Bitcoin fell below the critical $100,000 mark on November 4, after hitting an all-time high of $126,198.07 in October. The drop marked a 10% decline in just one week, triggering widespread volatility across the entire crypto market.
The price drop resulted in over $1.3 billion in liquidations, with Bitcoin’s leveraged positions hit hardest. Additionally, Bitcoin ETFs saw $578 million in outflows, continuing a trend of redemption, while Solana ETFs saw inflows.
Sluggish demand from both retail and institutional investors contributed to the price fall. U.S. Bitcoin ETFs became net sellers, with a seven-day average outflow of 281 BTC, signaling waning interest after a strong rally in September.
Bitcoin’s decline also reflects broader market trends, such as uncertainty in the AI sector and rising concerns over the Federal Reserve’s policies. Additionally, Bitcoin’s price movement is still closely tied to equity markets, showing its vulnerability to global macroeconomic factors.
Analysts predict that Bitcoin may continue to dip to the $92,000–$95,000 range, with some even forecasting drops as low as $70,000. However, many see the recent crash as a healthy correction, with Bitcoin’s long-term fundamentals, including institutional interest and a capped supply, remaining strong.
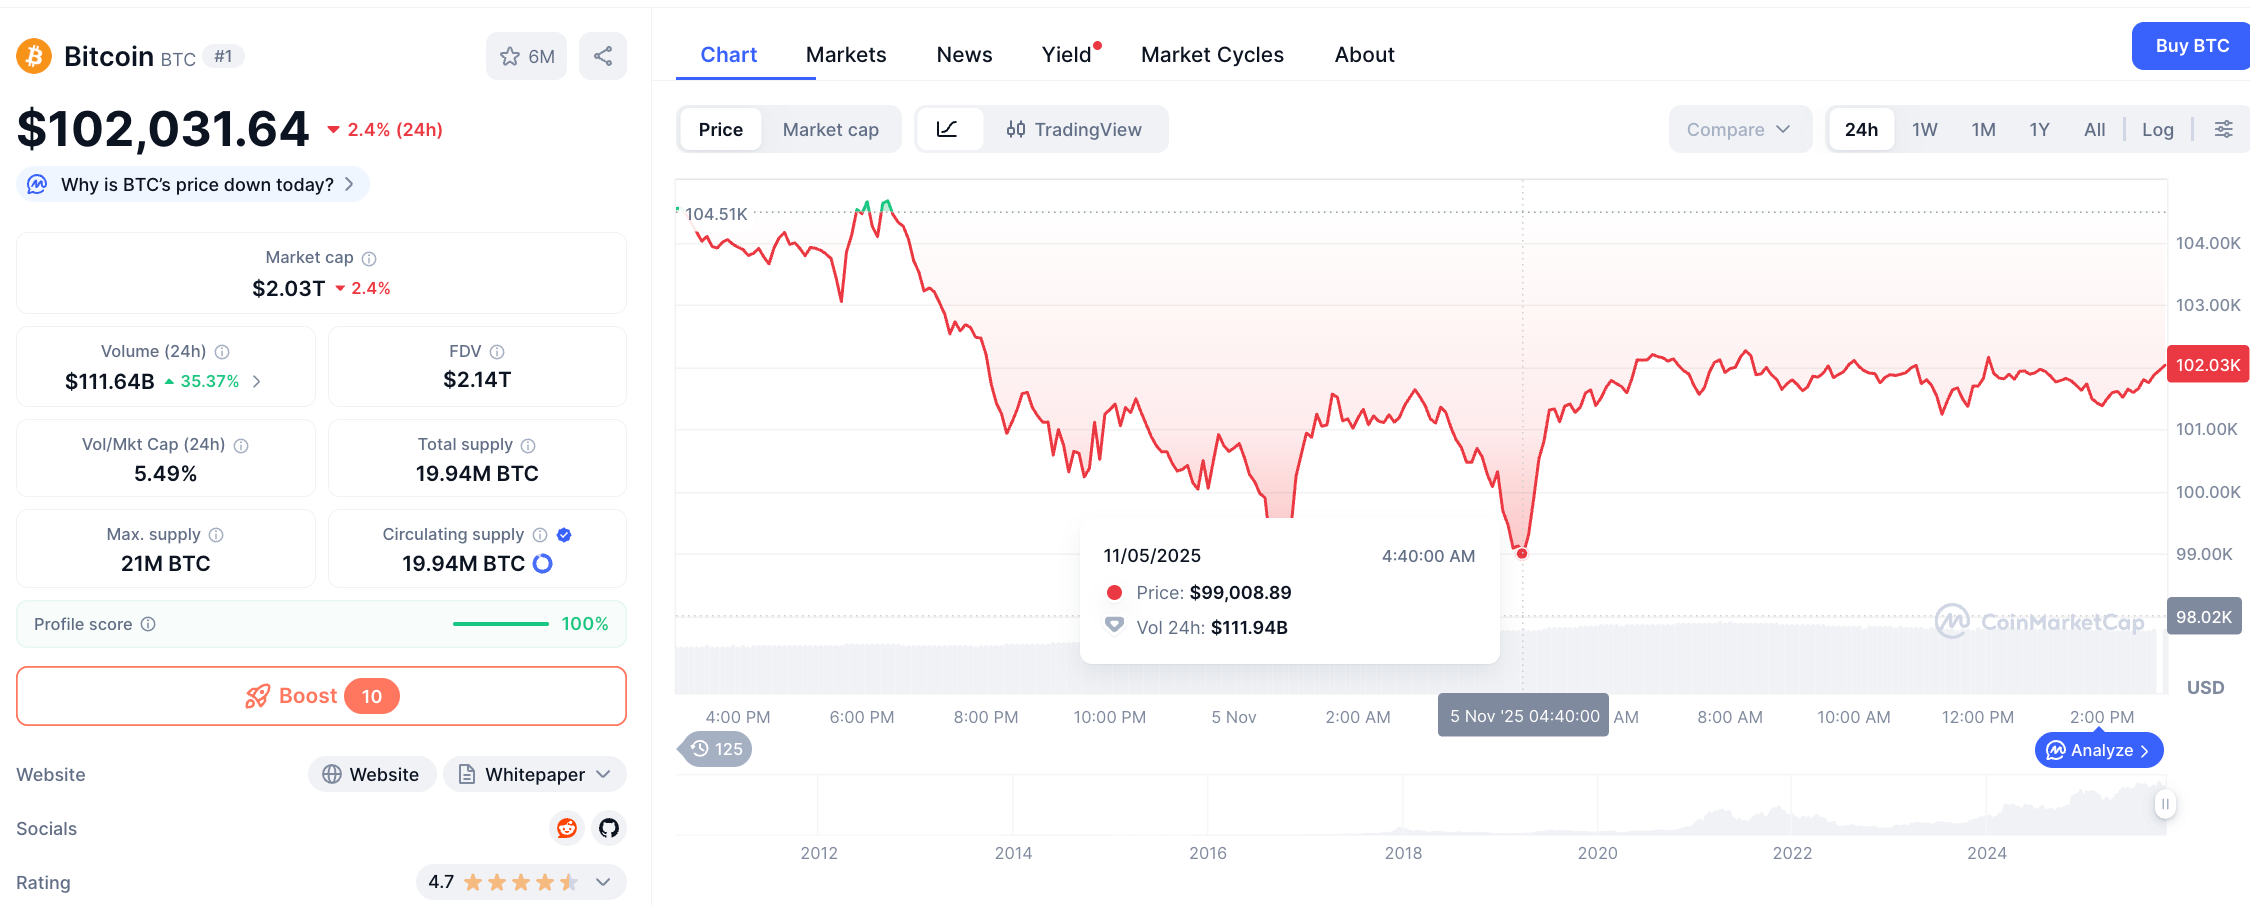
The world’s largest cryptocurrency, Bitcoin, slips below the crucial $100,000 psychological level on November 4, marking its sharpest two-day fall in months.
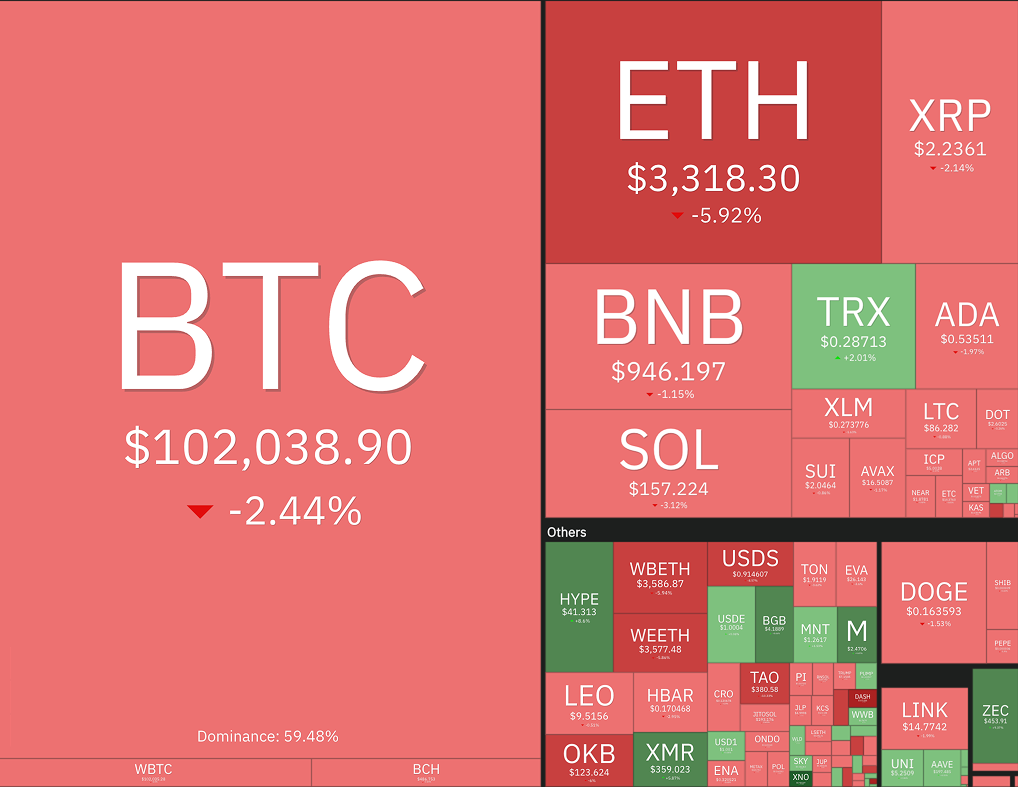
After hitting record highs in October 2025, with BTC’s new ATH at $126,198.07, the Bitcoin price dropped by nearly 10% in 1 week. Following the first cryptocurrency, the entire cryptocurrency market turned red according to Coin360.
$ETH plunged 17.43% over last week, while $XRP (-15.74%), $BNB (-15.16%), and $SOL (20.99%) followed with double-digit losses. The Bitcoin fall sparked wild volatility on major crypto exchanges and in community chats.
Bitcoin price drop triggered total liquidations exceeding $1.3 billion, with longs accounting for $1.113 billion, marking one of the largest single-day deleveraging events since May 2021.
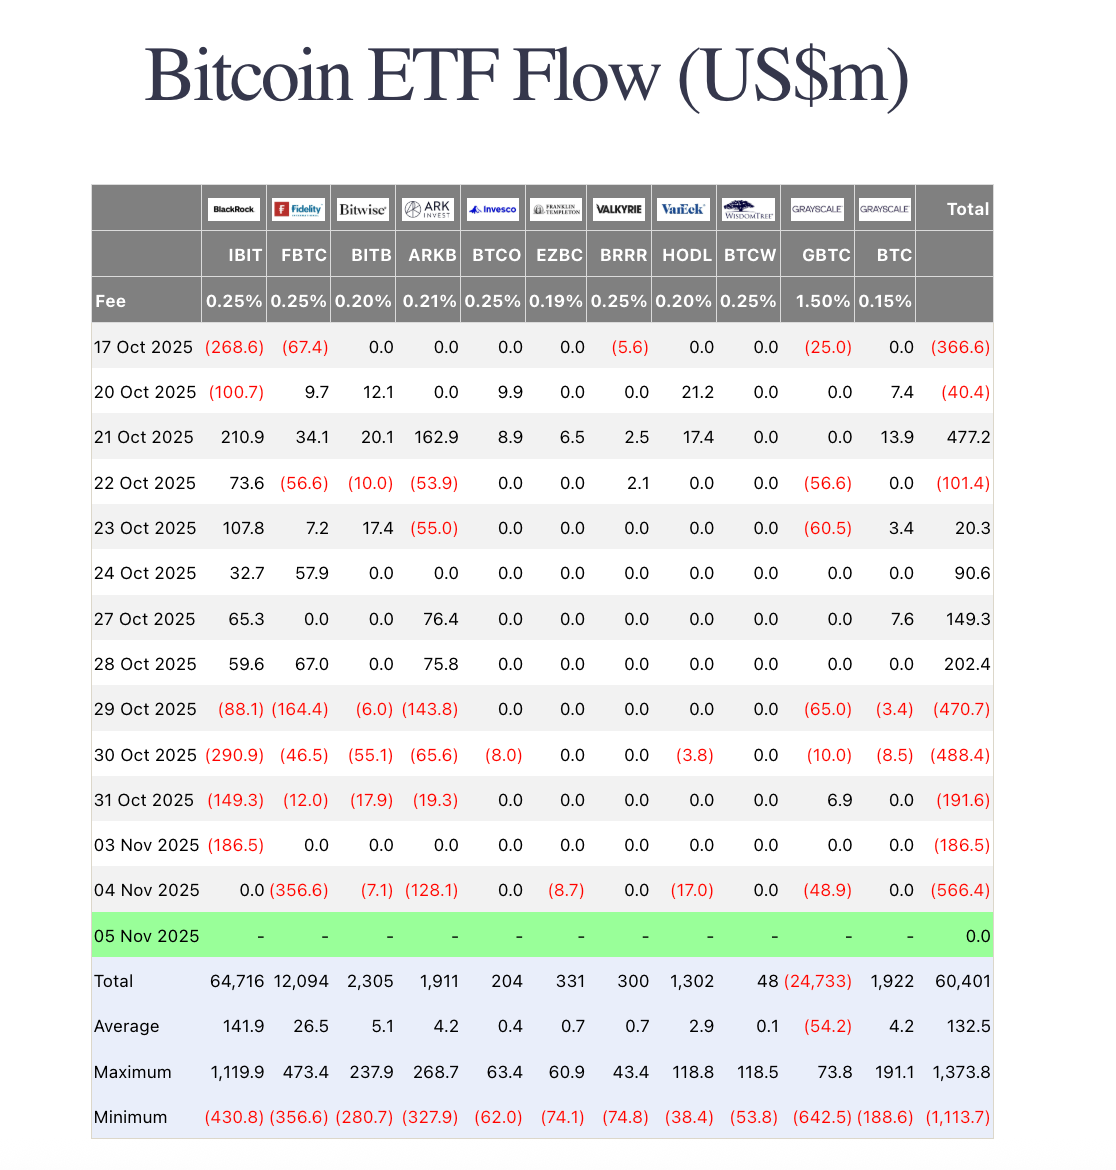
Spot Bitcoin ETFs saw $578 million in outflows, their fifth straight day of redemptions; Ethereum ETFs lost $219 million, while Solana ETFs extended their winning streak with $14.83 million in inflows. Crypto market capitalization fell 2.5% to $3.39 trillion, erasing $289 billion in value within 24 hours.
But what’s behind this crypto market crash? Let’s highlight the most discussed reasons.
The latest Bitcoin price drop has several interconnected causes — both technical and macroeconomic. Let’s break them down.
1. Weak Buyer Activity Following October’s Large Liquidations
After the significant market correction on October 10, Bitcoin has faced sluggish demand from both retail and institutional investors. CryptoQuant links the recent price drop to reduced buying interest post the large-scale liquidation event [1]. U.S. investor demand for both Bitcoin and Ethereum has noticeably slowed down, particularly in the spot and derivative markets. After a strong rally in late September, which saw Bitcoin peak at $126K and Ethereum near $5K, the enthusiasm for further exposure has faded.
Key metrics, such as ETF inflows, spot exchange premiums, and futures basis metrics, reflect diminished interest from both U.S. institutions and retail investors. Instead of fresh accumulation, the current phase appears to be driven by profit-taking and cautious positioning. Notably, U.S. Bitcoin ETFs have become net sellers, with a seven-day average outflow of 281 BTC — one of the weakest readings since April. Similarly, Ethereum ETF inflows have stalled since mid-August, highlighting investor caution.
2. Leverage Cascade and Liquidations
Bitcoin’s rally throughout October encouraged many traders to leverage long positions, betting on a new all-time high above $120,000. However, when Bitcoin’s price slipped below $109,000, margin calls triggered automated liquidations, which further accelerated the price drop.
Bitcoin’s price decrease from $112,000 to below $106,000 resulted in over $1.27 billion in leveraged futures liquidations. Long traders, who had the most exposure, were hit hardest, with $1.14 billion in bullish bets wiped out. The largest liquidation occurred on the BTC-USDT pair on HTX, with a $33.95 million position being closed [2].
3. Institutional Outflows From Bitcoin ETFs
Institutional investors withdrew a significant $1.15 billion from Bitcoin ETFs last week. This outflow, primarily driven by major players like BlackRock, ARK Invest, and Fidelity, signals a notable shift in sentiment. These institutions, which were pivotal in pushing Bitcoin’s price to $126,000 in early October, are now reducing their exposure. This pullback is largely due to rising uncertainty regarding the Federal Reserve’s policies and concerns over the AI sector’s overvaluation.
4. Miner Sell-Offs and Profit-Taking
As Bitcoin’s price surged in October, mining profitability improved, prompting many miners to sell portions of their reserves to lock in profits. These sell-offs added additional selling pressure on the market, particularly as retail enthusiasm began to wane, worsening the Bitcoin price fall.
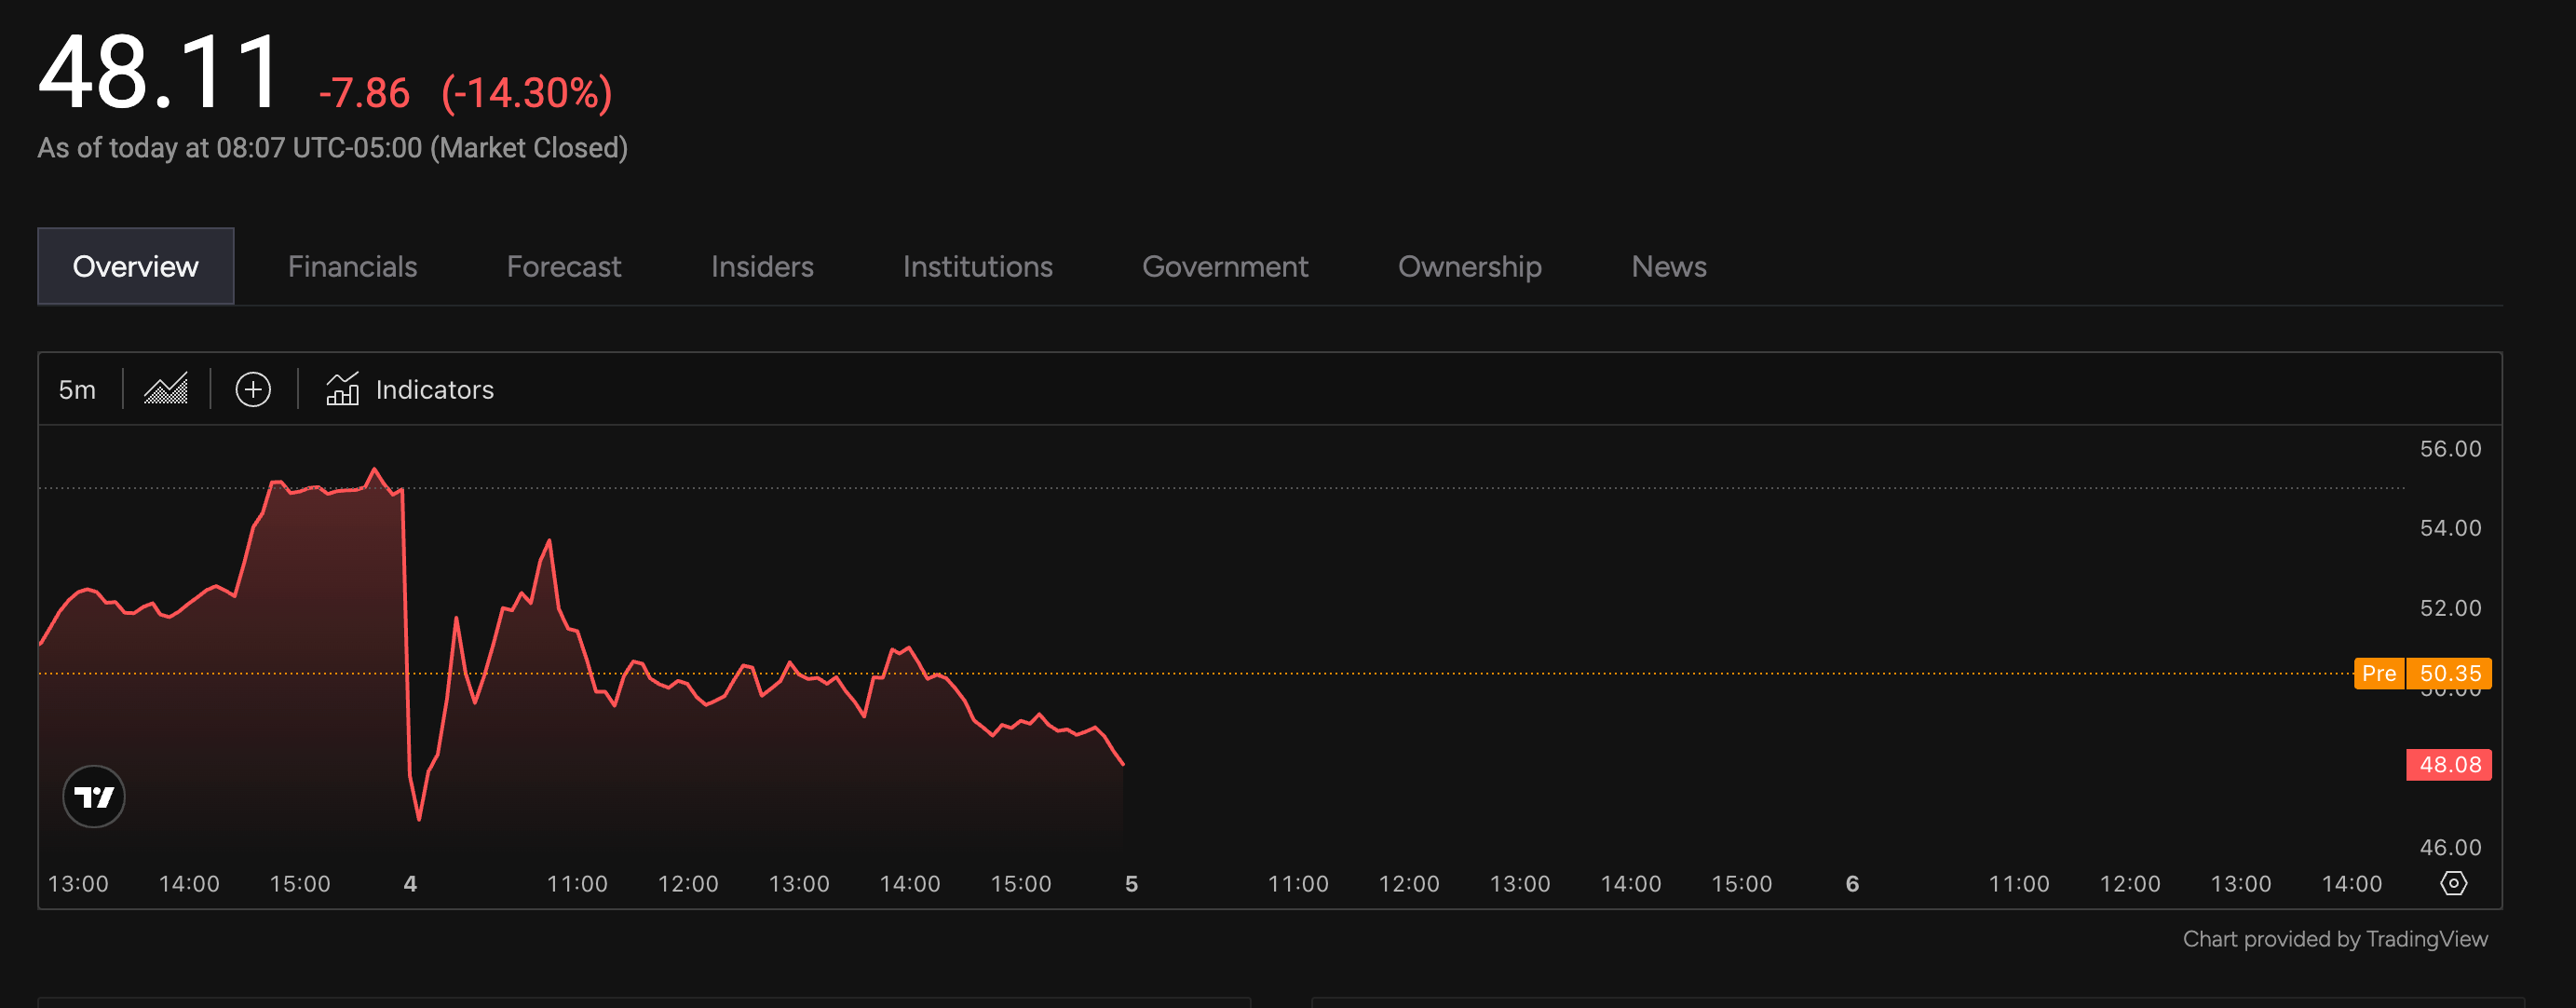
Notable mining firms such as Hut 8 (HUT) saw their stock price decline by over 10%, despite strong third-quarter earnings.
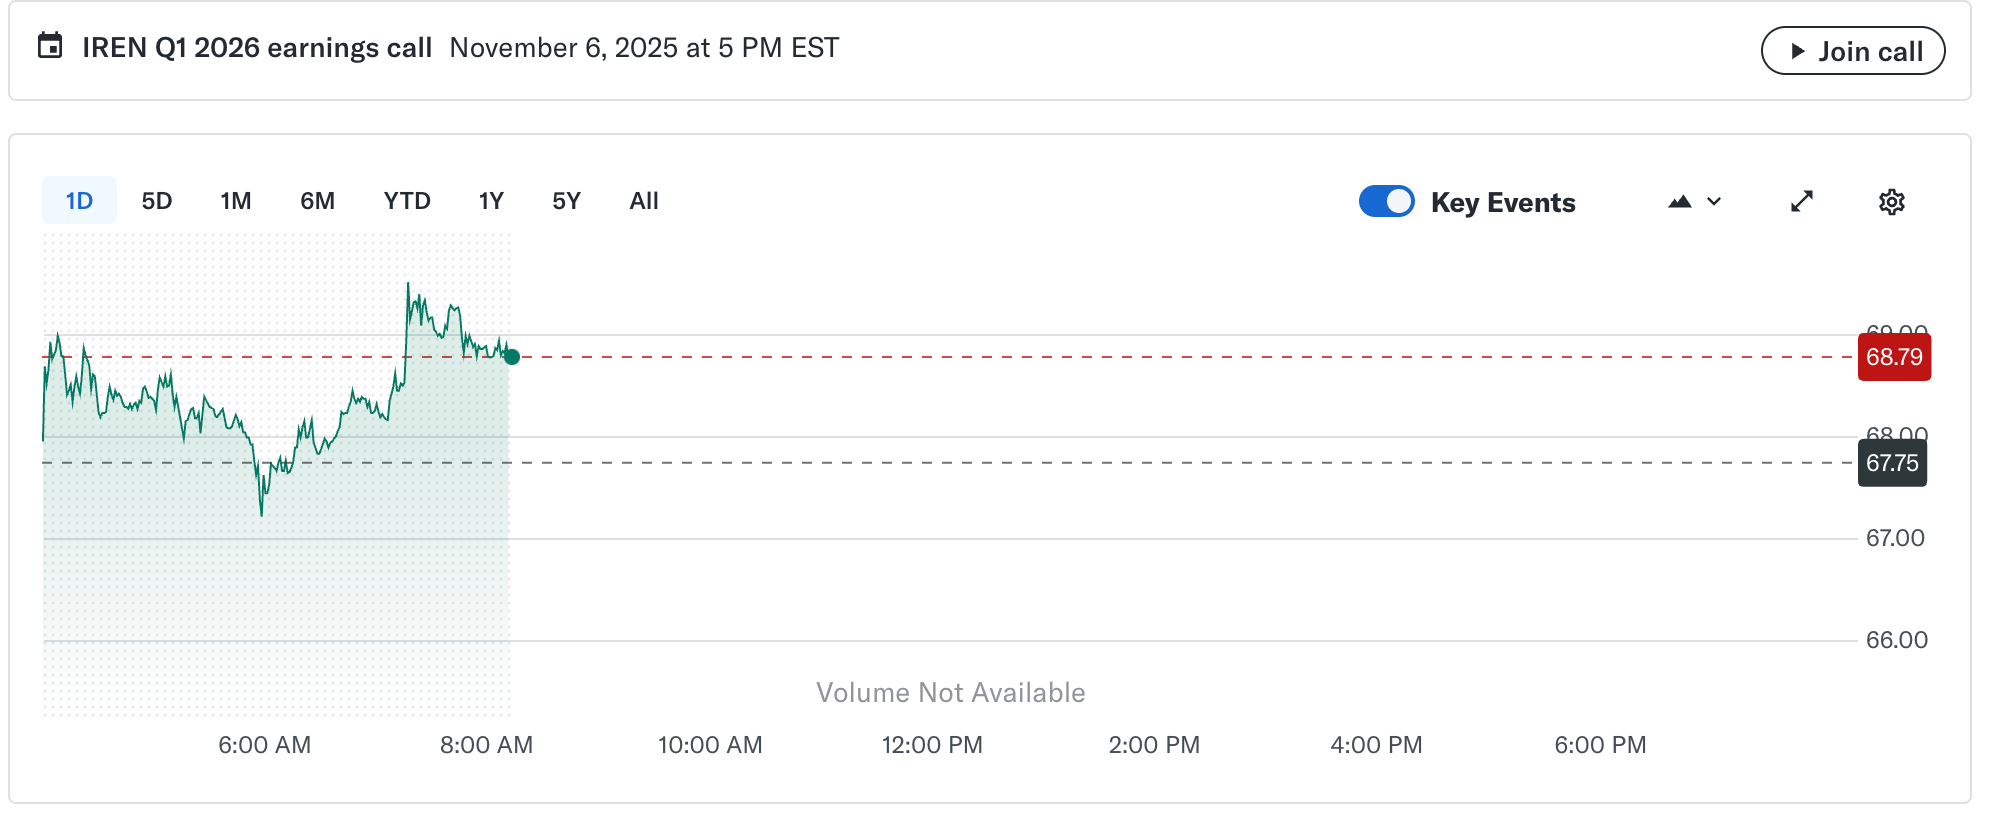
Other mining companies like Hive Digital (HIVE), Bit Digital (BTBT), and Terawulf (WULF) also experienced losses, with drops of more than 6%. However, Australian miner Iren (IREN), focused on providing capacity for AI customers, managed to stay relatively stable.
5. AI Bubble Contagion
Crypto and AI are close relatives — both built on hype, speculation, and investor faith in “the technology of the future.” But now, even the AI sector — once the golden child of innovation – is showing classic signs of overheating. Reports suggest that AI-related capital spending has overtaken consumer demand as a key growth driver of the U.S. economy, and yet returns remain elusive.
Major industry leaders are already sounding the alarm. Goldman Sachs CEO David Solomon warned that a lot of capital won't deliver returns [3]. Jeff Bezos called the current AI boom “an industrial bubble” [4]. And even Sam Altman admitted that people tend to overinvest and might just lose money [5]. When big tech giants — from OpenAI and Nvidia to Microsoft and Google — are tied together by massive, over-leveraged deals, a correction in AI could easily spill over into crypto.
After all, both markets thrive on risk appetite. When one “future tech” bubble starts to deflate, investor psychology shifts – from speculative euphoria to capital preservation. And that shift doesn’t stop at AI; it drags the entire tech ecosystem down with it.
6. Broader Market Correlation
Bitcoin’s price movements have closely tracked the broader equity markets, particularly the S&P 500 and Nasdaq indices. As global equities corrected after the release of U.S. inflation data, Bitcoin, still viewed as a risk asset, also saw a decline. The correlation between Bitcoin and traditional markets remains strong, making it susceptible to the same macroeconomic factors that influence stocks.
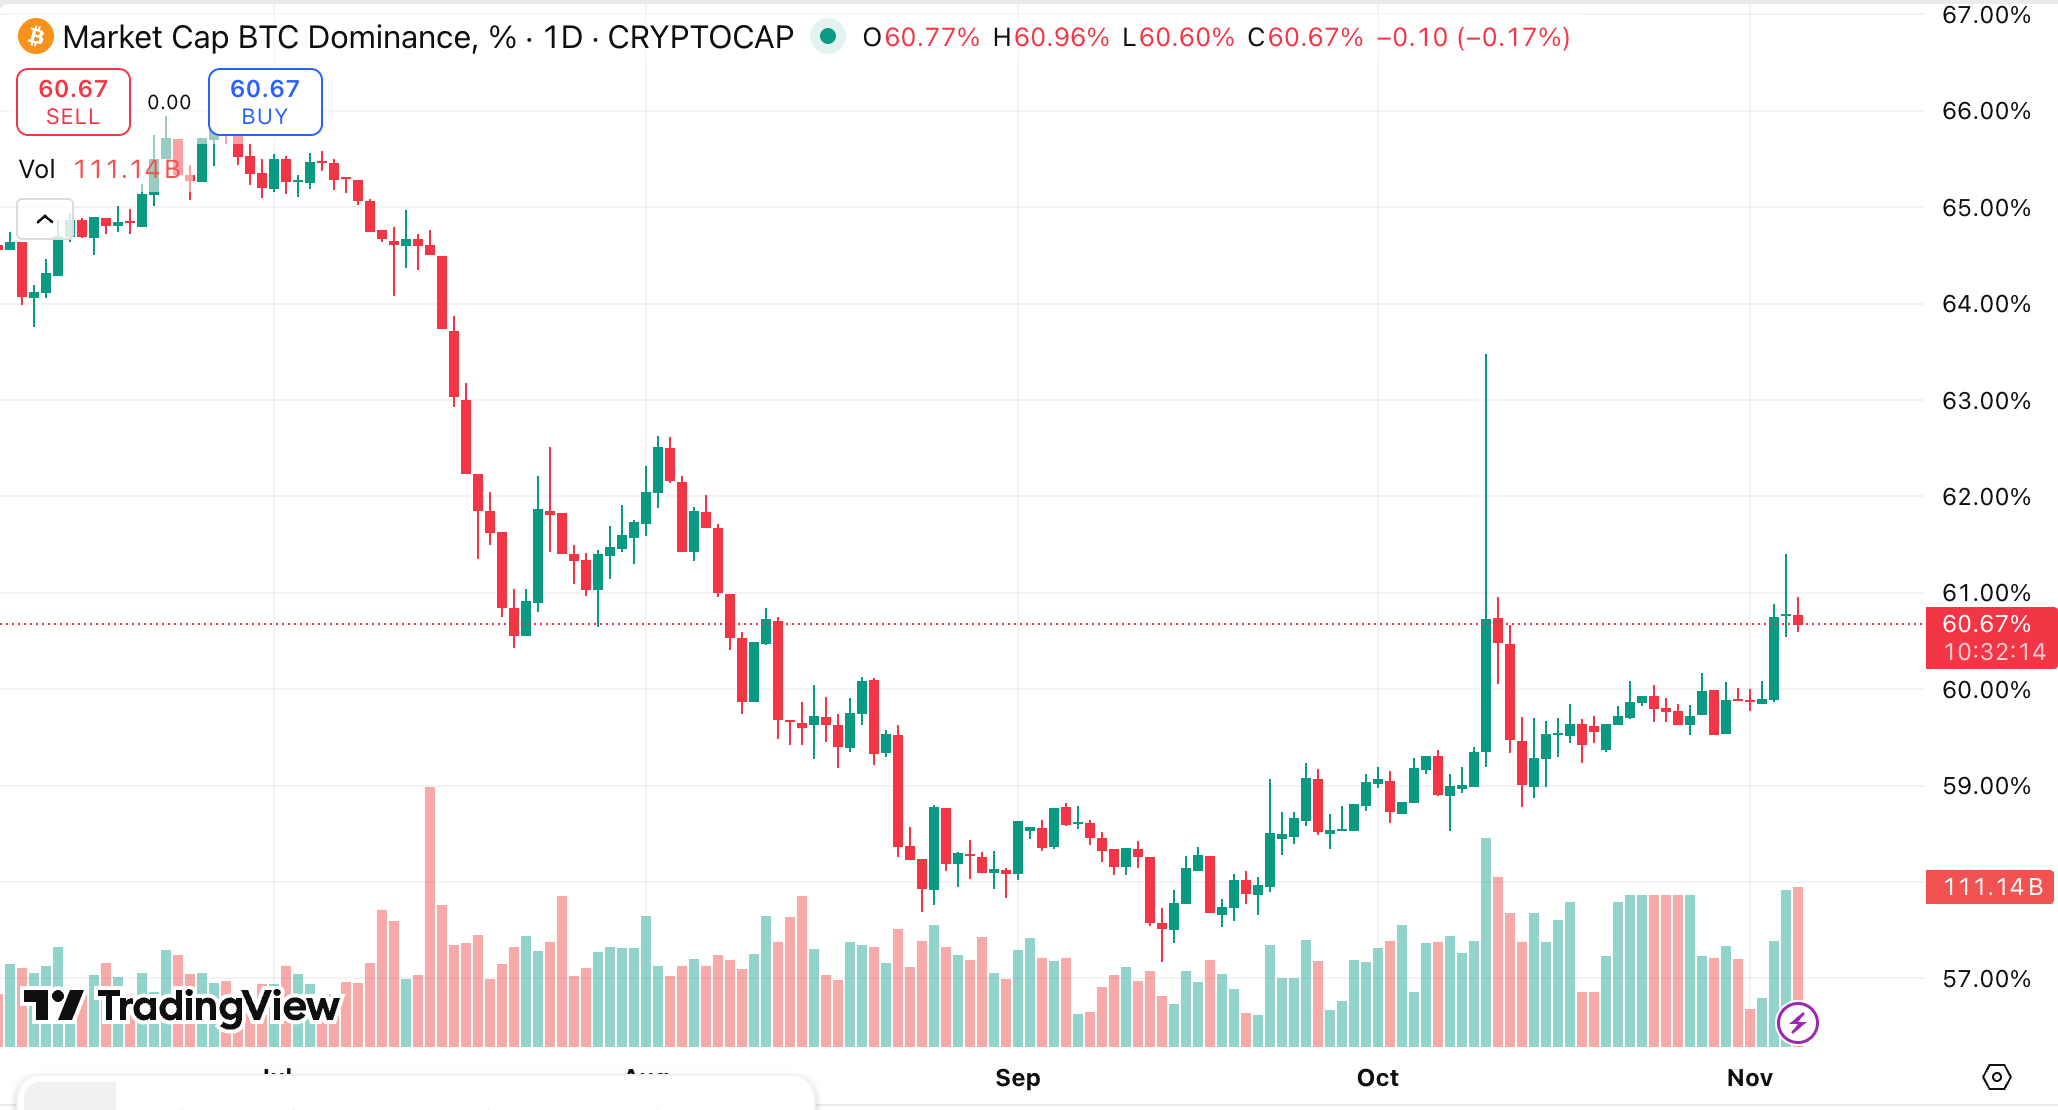
The chart reveals significant spikes and pullbacks in dominance, with increased trading volume during key movements.
How Low Could Bitcoin Go?
Technical analysts warn that losing the $100K support could open the door to a deeper pullback toward the $92,000–$95,000 zone. Some of them highlight that if the Bitcoin price keeps dropping, we might face a new bear market. For instance, Julio Moreno, Head of Research at CryptoQuant, in his X noted, that Bitcoin needs to gain price quickly, otherwise we risk repeating the 2022 bear market scenario:
Bitcoin dropped below its 200-day moving average. It marks a key technical break that could indicate further declines, according to Katie Stockton, founder and managing partner at Fairlead Strategies.
This moving average, a widely followed indicator, often serves as a benchmark for long-term trends and acts as a support level for the cryptocurrency in this case.
“We assume the corrective phase will keep hold of bitcoin for another few weeks.”
However, long-term fundamentals remain strong: Bitcoin ETFs continue to attract steady inflows overall, and network activity remains high.
Jon Glover, Chief Investment Officer at Ledn and Elliott Wave analyst, predicts that Bitcoin could drop to $70,000 or lower, signaling the end of the bull market that started in early 2023. This forecast implies a possible 35% decline from its current level of around $108,000.
“I expect bitcoin to trade between $70K and $80K, and possibly even lower.”
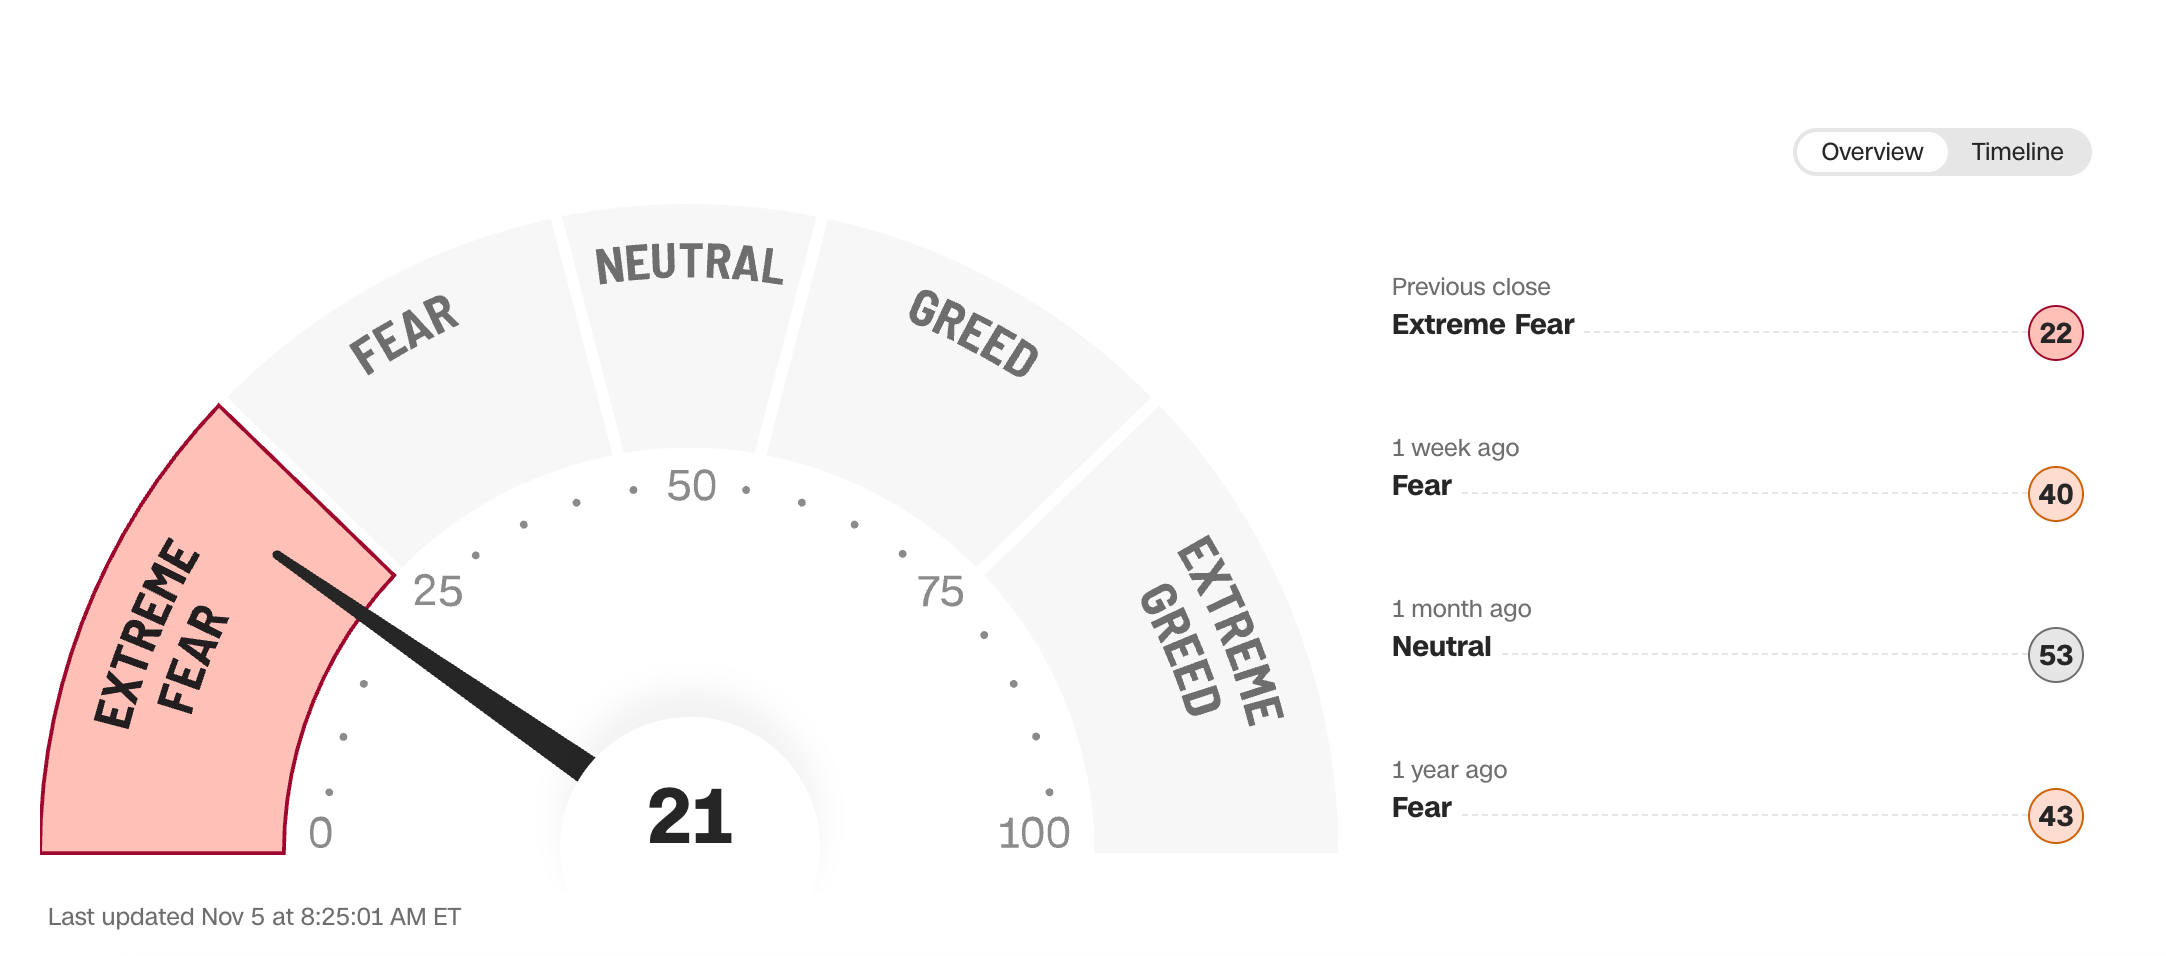
Investor sentiment is overall in the “fear” zone right now, according to the Fear and Greed index, which now stands at extreme fear.
Some analysts view the current Bitcoin crash as a healthy correction following an overheated October rally.
"Bitcoin's first red October in seven years has certainly caught attention, but I see it more as a healthy reset than a structural reversal. October's correction has done what it needed to: it has flushed out leverage and re-set sentiment."- said Rachel Lin, CEO of SynFutures [6].
Pauline Shangett, Chief Strategy Officer at ChangeNOW, also points out that the recent Bitcoin price drop is a predictable occurrence:
“I wouldn’t call this drop a surprise; the market’s just catching its breath after a pretty wild rally. Big holders are taking some profits, ETF inflows have cooled off a bit, and that’s totally normal for a maturing market. The macro picture’s still tricky, tight liquidity and cautious sentiment after the U.S. news are weighing in, but Bitcoin’s fundamentals remain strong. Institutional interest is still there, on-chain data show selling pressure is easing, and overall it feels more like a healthy reset than the start of a downturn.”
Bitcoin price decline is seen as a natural market correction rather than a sign of a long-term downturn. Despite ongoing macroeconomic challenges, Bitcoin’s fundamentals remain solid, and investor sentiment suggests this is a healthy reset for the cryptocurrency market.
Is Bitcoin Dead? Definitely Not.
Every sharp correction revives the classic question: “Is Bitcoin dead?” The short answer — absolutely not.
Bitcoin’s price is falling, but that doesn’t change its fundamental position as the world’s leading digital asset. Historically, BTC has endured dozens of pullbacks larger than this one — including drops of 30–50% — before eventually setting new all-time highs.
As institutional interest grows and supply remains capped, the long-term thesis for Bitcoin stays intact.
This milestone is expected to deepen global liquidity and strengthen Bitcoin’s legitimacy among institutional players.
Yet the timing was unfortunate: as the ETF news spread, Bitcoin’s price continued to sink, suggesting that broader market sentiment remains cautious.
That Bitcoin recently fell below the key $100,000 level, after it had gained significantly in October, could be a sign of further declines, to ranges such as $92,000-$95,000, according to some analysts. Low buyer activity, liquidation, technical issues, and overall market volatility are contributing to the slump.
To many experts, however, the BTC crash seems like a normal correction rather than the beginning of a longer-term decline. They think that the market is just readjusting after an overheated rally. The short-term outlook remains uncertain, but Bitcoin's long-term fundamentals — strong network activity, institutional interest, and limited supply — indicate that it is likely to stay the most valuable digital asset for a long time.
Information in this article was gathered and written on November 5, 2025. Please note that its relevance may change over time, and some details may become outdated
Ethereum is about to undergo its most radical transformation since the Merge. Discover how the newly announced "Lean Ethereum" roadmap will unlock blazing-fast speeds, post-quantum security, and built-in validator privacy to rebuild the network's core architecture.