Chainlink price prediction for 2027 ranges from $7.29 to $14.94 on average, while the outlook for 2028 and 2032 depends on one question: can LINK turn growing bank adoption into demand for the token?
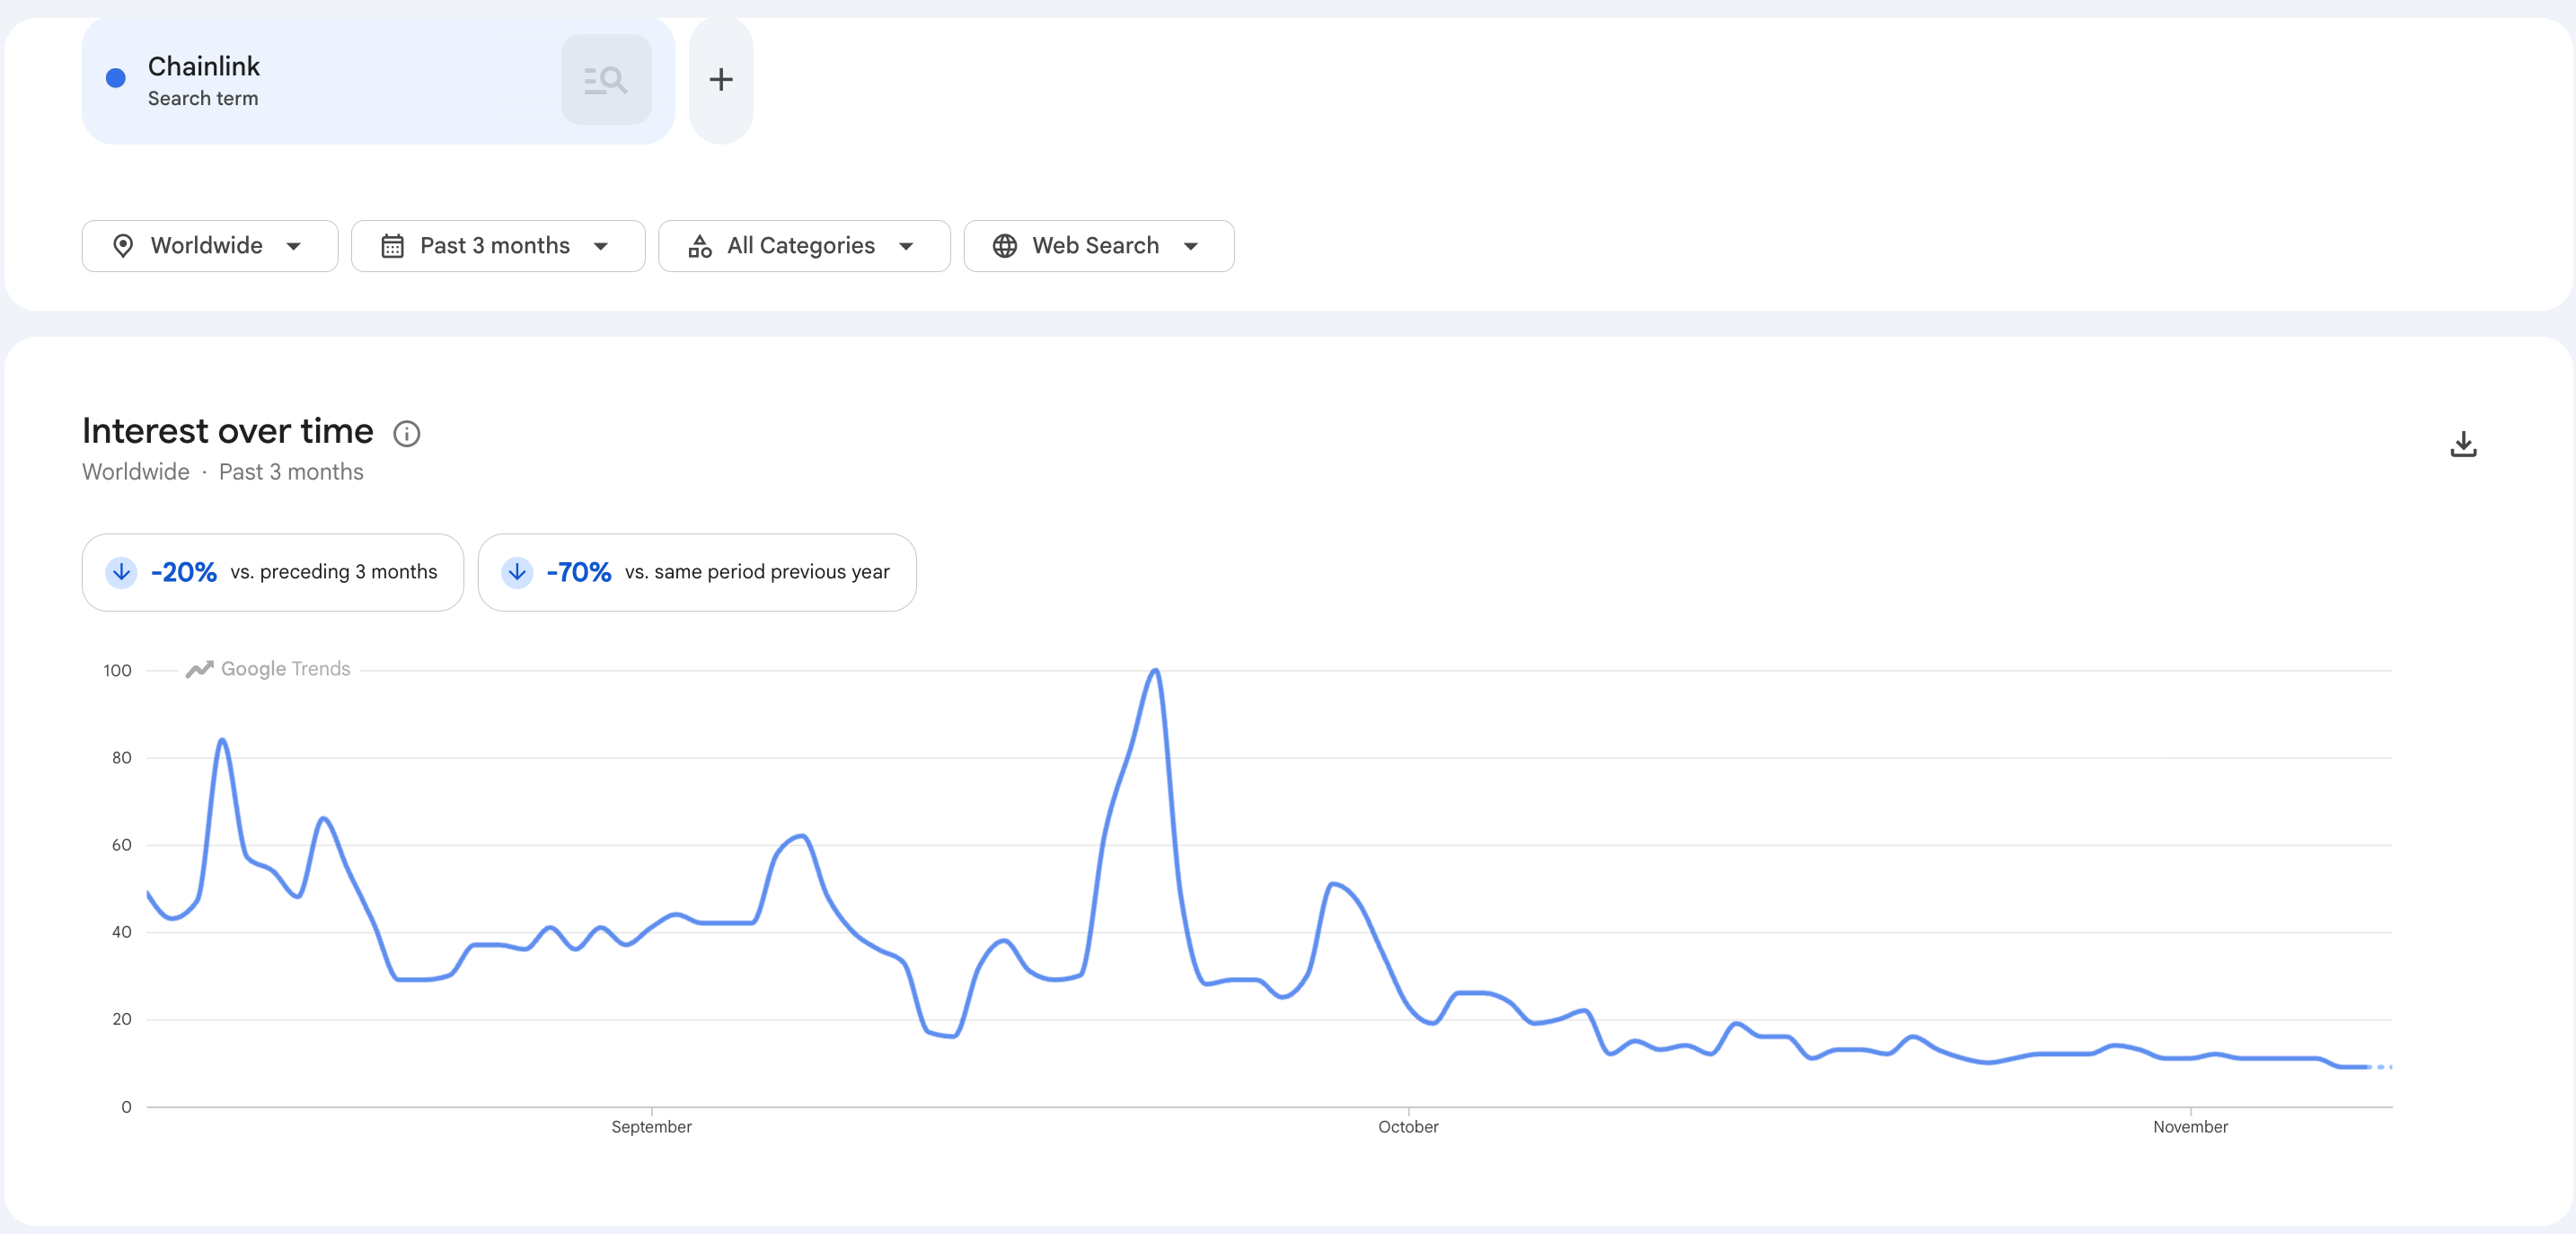
Chainlink announced CCIP 2.0 and a full implementation strategy with Swift, and for many people it was the first time they heard about the project. Yet LINK trades near $11, about 80% below its 2021 peak, and Google search interest in Chainlink is down 70% compared with the same period last year.
To build this Chainlink price prediction, we combined technical market data with community sentiment. We looked at trading volumes, recent price floors, Reddit discussions, Google search interest, the Fear & Greed Index and ChangeNOW exchange data to understand what the market expects from LINK.
For the actual price ranges, we reviewed forecasting models from Standard Chartered, DappRadar and CoinCodex. These platforms set the baseline and peak figures for each year. We then used the community analysis to map out the catalysts LINK needs to reach those numbers.
Disclaimer:This article is for informational purposes only and does not constitute investment advice or a recommendation to buy or sell crypto assets. Any views, opinions, or forward-looking statements reflect current market sentiment and publicly available information and should not be relied upon as a basis for investment decisions.
Where LINK Stands Now
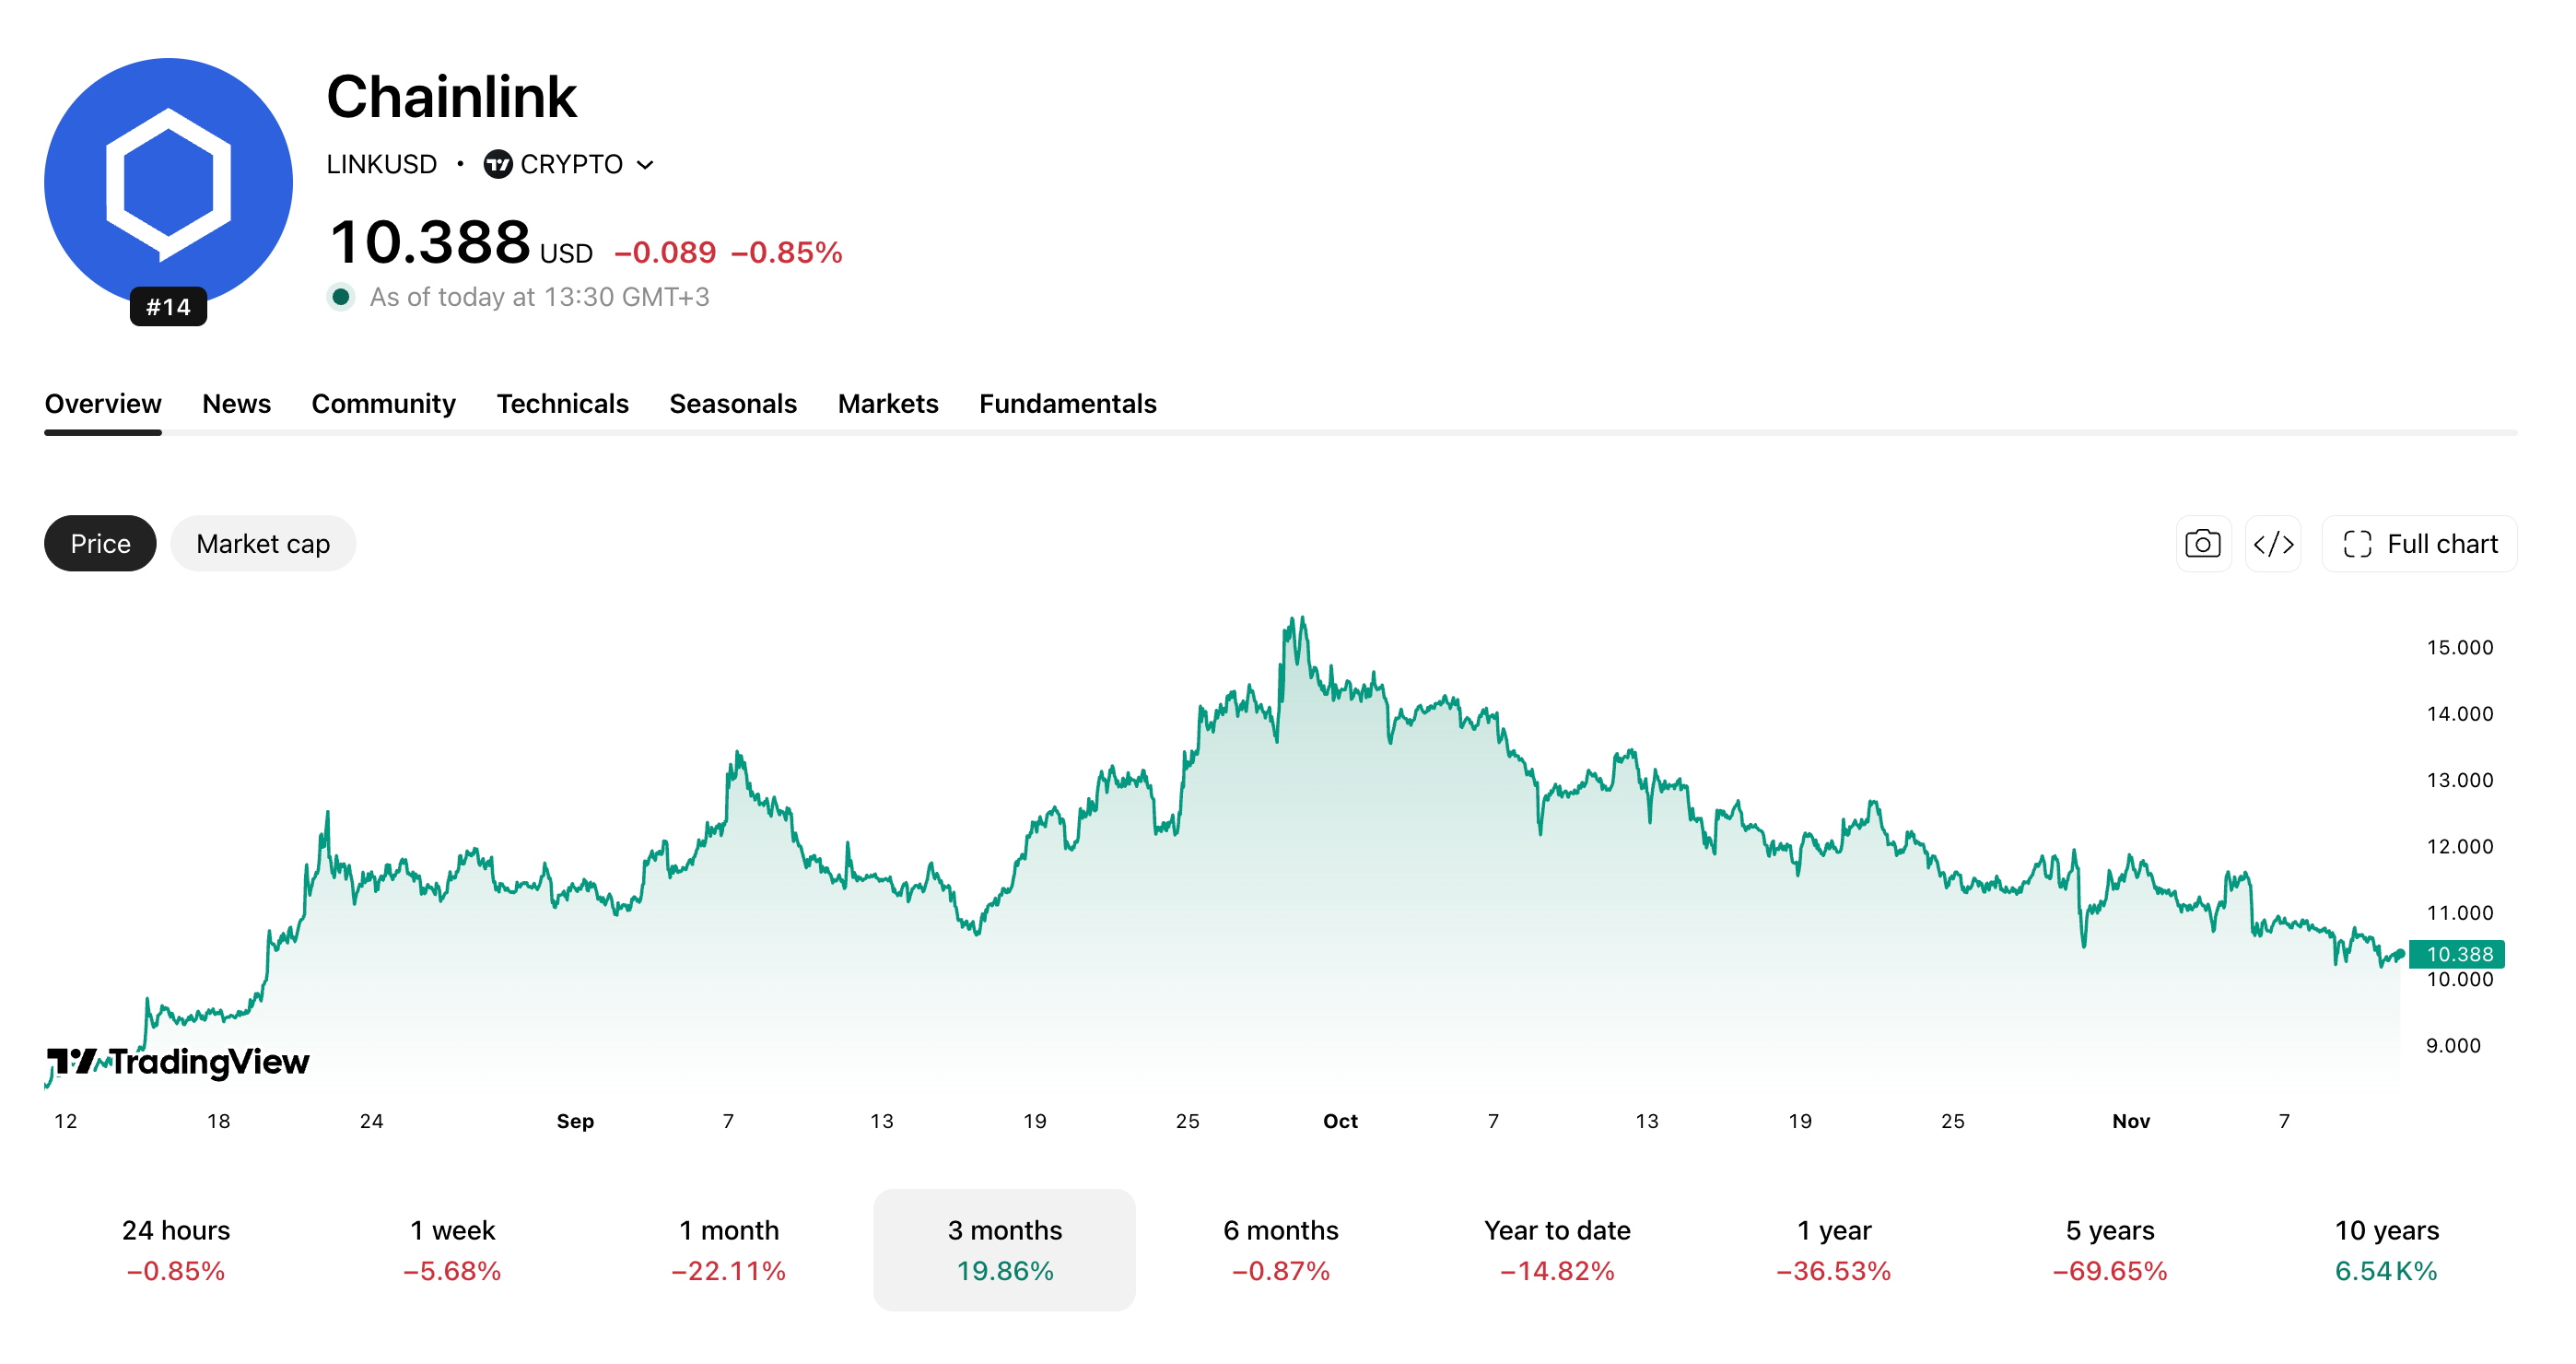
LINK trades around $10.60 in early November 2026, according to CoinGecko and Coinbase. That is about a third below its late-September high of $15.75, after an 18.7% drop in October.
Frequently Asked Questions about Chainlink (LINK) Price Prediction
Forecasts average $14.94 for 2027, with high estimates around $41. The actual price depends entirely on whether current Swift and DTCC network tests evolve into daily commercial operations that require the LINK token.
Algorithmic models from DappRadar and CoinCodex predict Chainlink will peak between $29 and $47 by 2030. Bank analysts are more aggressive, projecting up to $200, but this relies heavily on institutional adoption scaling globally and driving direct token demand.
The price is down because token demand remains disconnected from project growth. Despite major tech upgrades like CCIP 2.0, retail interest has dropped, and institutional partnerships have not yet generated enough daily transaction volume to push the price higher.
The biggest structural risk is banks adopting Chainlink's technology but finding ways to execute transactions without holding or spending the LINK token. Other risks include strict government regulations, token unlock sell pressure, and faster competitors capturing market share.
CCIP (Cross-Chain Interoperability Protocol) moves data and tokens across different blockchains. Users pay fees to execute these cross-chain transactions, and the system requires LINK to process them, creating direct utility for the token.
The Chainlink Reserve is an onchain smart contract on Ethereum that holds LINK for the long term. Chainlink funds it by converting company revenue into LINK. It launched on August 7, 2025, and Chainlink does not expect withdrawals for multiple years.
Chainlink is the legacy market leader with the most enterprise partnerships and total value secured. Competitors like Pyth operate differently, offering faster "pull" oracle models favored by high-frequency trading apps, mostly on the Solana network.
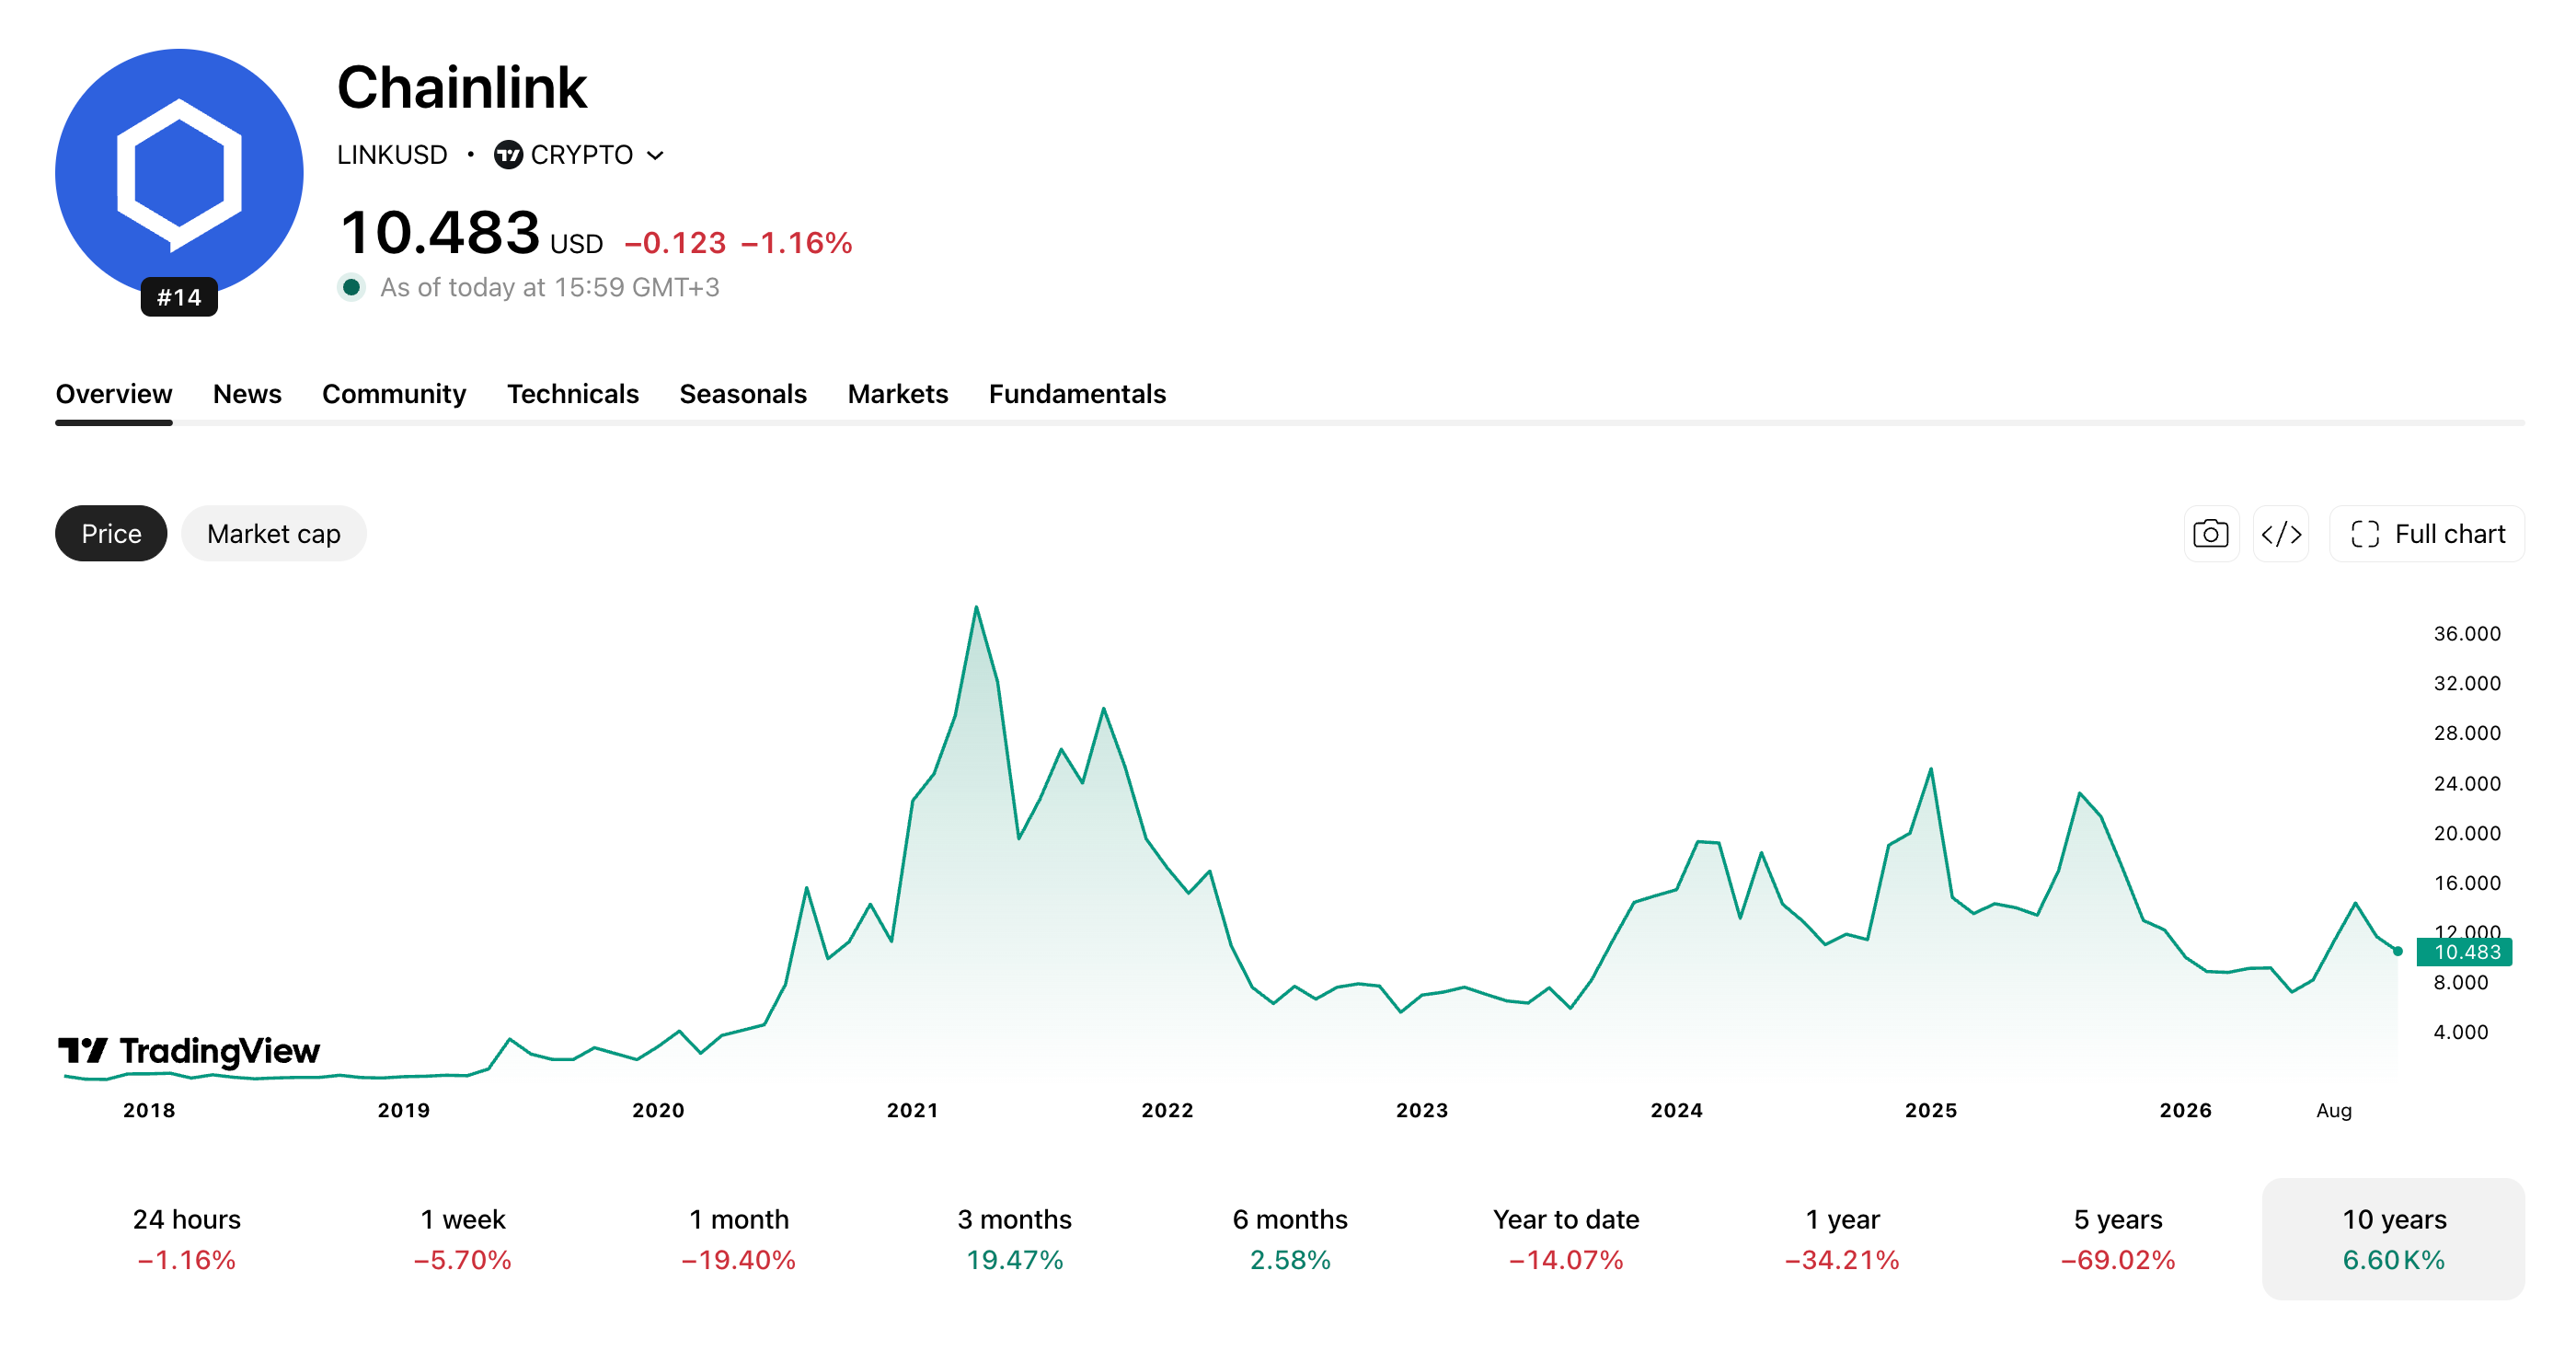
Chainlink hit an all-time high of $52.88 on May 10, 2021. At current prices near $10.60, it remains about 80% below that peak.
Any official updates regarding the Swift and DTCC pilots moving into commercial production would act as a major catalyst. Additionally, broad market shifts involving Bitcoin will likely pull LINK in the same direction.
On September 28, 2026, Chainlink launched CCIP 2.0 which stands for Cross-Chain Interoperability Protocol. It’s the system that moves tokens and data between blockchains and announced that banks can connect to Swift’s blockchain ledger through Chainlink.
At the same Sibos conference, DTCC, the US securities clearing house, presented a 24/7 collateral platform that will use Chainlink technology.
On October 29, attackers took about $6.3 billion from Binance, one of the largest venues for LINK trading and LINK fell about 3% the next day while its trading volume nearly tripled.
Quick summary:Chainlink launched in 2017, hit an all-time high of $52.88 in May 2021 and lost about 90% of that value by late 2022. LINK recovered to about $30 in December 2024, reached about $15.75 in September 2026 and now trades near $10.60.
LINK first traded in September 2017 at about 17 cents. The first big run came in 2020, when DeFi apps began using Chainlink price feeds. The main phases since then look like this:
2020 DeFi boom: Lending and trading apps adopted Chainlink price feeds, and LINK climbed above $20 by August 2020.
May 2021 peak: LINK hit its all-time high of $52.88 on May 10, 2021, in the same bull market that lifted most altcoins.
2022 to 2023 bear market: LINK lost about 90% from its peak. It fell to about $5.40 in 2022 and spent most of the next two years between $5 and $10.
2024 recovery: LINK reached $22.87 in March and about $30 in December, as the market recovered and more projects adopted CCIP.
2025 pullback: LINK returned to the high $20s in August, after the launch of the Chainlink Reserve, then ended the year near $12.
2026 swings: LINK dropped to about $7 in July, then jumped to about $15.75 in late September after CCIP 2.0 went live. It has since fallen about a third, to around $10.60.
Each rally since 2021 has topped out lower than the one before: about $30 in 2024, about $28 in 2025 and about $16 in 2026.
Market Sentiment: What the Crowd Is Saying About Chainlink
Chainlink sentiment is split: social data leans positive, while price and search interest keep falling. The wider market is cautious too, with the Fear & Greed Index at 36 - fear as of November 12, 2026.
Social Metrics: LunarCrush and Google Trends
Overall global search interest in Chainlink is down 20% from the previous three months and 70% from a year ago.
Interest did peak in September but has since fallen to about a tenth of that level. Even the autumn’s institutional headlines did not bring retail searches back.
Meanwhile, data on social media sentiment from LunarCrush shows bullish sentiment rising 16% over the past month. All while LINK lost about 19% in price.
Charles Schwab and its integration of LINK into trading naturally is the most popular topic in LINK conversations on X right now.
LunarCrush’s data also hints at the split in the current discussion: 55% of the audience are supportive and 45% are critical. The main complaint from the critics seems to be high gas fees.
Social media: Reddit and X
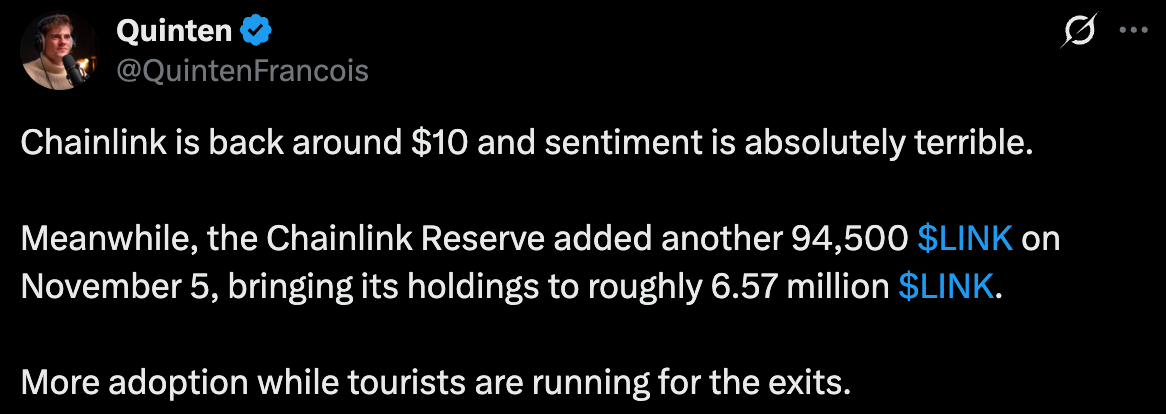
Posts show a distinct disconnection between the mood around LINK and what the project is doing.
Enthusiasts and people who follow the project closely are sure real adoption is around the corner. Banks, Swift and DTCC are already building on Chainlink, they say, and the team will find a way to tie that success to the price of the token.
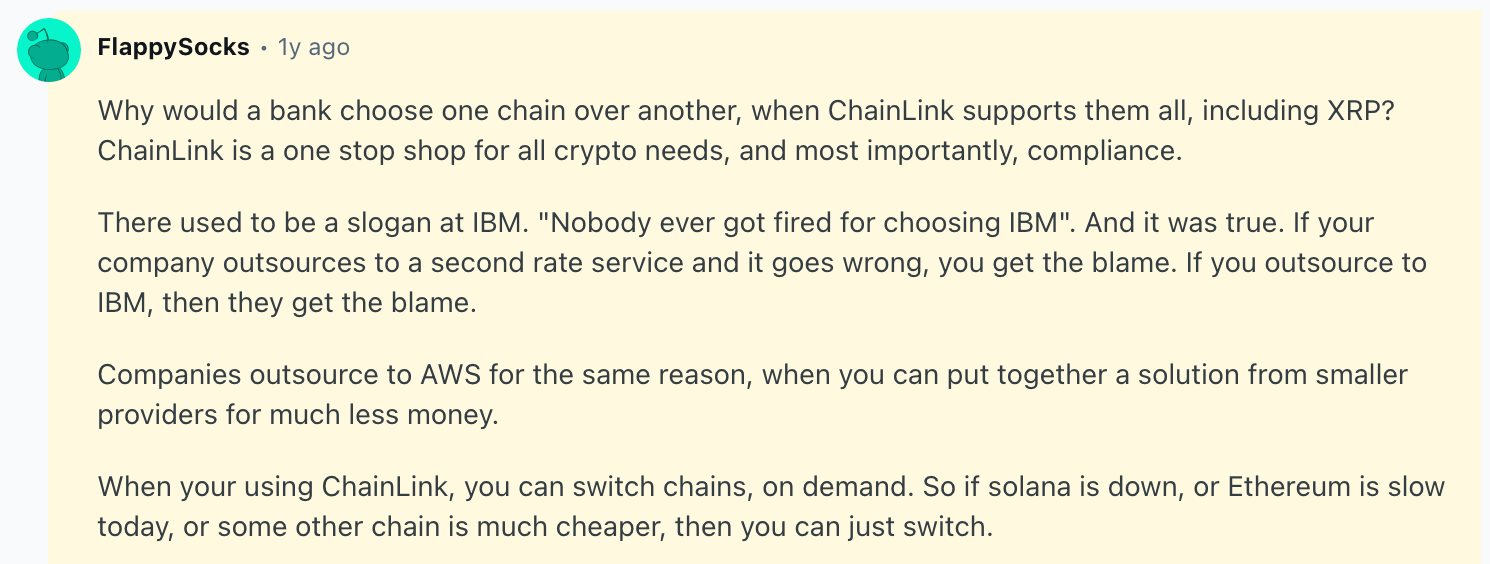
One Reddit commenter compared Chainlink to IBM in its prime: banks pick the safe supplier that covers every chain and keeps the compliance team calm. For this crowd, a flat chart is just the waiting room before the good part.
Others are simply tired of waiting. Some have held LINK since the 2017 ICO and have heard “adoption is coming” every year since. People don’t doubt that Chainlink is useful, but they want to know how all that usefulness ends up in the token. A treasury full of LINK is nice, commenters add, though tokens sitting in a wallet don’t do much until someone uses them. A few users joked that Schwab picked a gloomy day to list LINK.
Both camps keep coming back to the same question: when does adoption turn into demand for the token?
Chainlink Chart Analysis
Quick summary:As of November 11, 2026, LINK trades at $10.36 on Coinbase, about a third below its late-September peak. The daily RSI is 38, and total open interest is $237.7 million, down 1.87% in 24 hours.
LINK Price Trend
LINK current price dynamics can be described as “one good step forward, two small steps back”. The price climbed from about $7 in July to almost $16 at the end of September, then slid back to $10.
The top came in the same week as the CCIP 2.0 launch, which is not how launches are supposed to go. Since then, the price has been treading water below $12. A Chainlink long term price prediction has to start from this very base - a downtrend that has not turned yet.
LINK RSI Reading
The daily Relative Strength Index is 38 as of November 11, 2026.
Quick reminder:RSI measures buying and selling pressure on a scale from 0 to 100, and readings under 30 are called oversold.
In August, RSI was above 85 - a level where buyers had clearly gone all in. Three months later, it sits just above the oversold line. Sellers lead, but not out of panic.
LINK Open Interest
LINK open interest is $237.7 million, down 1.87% over the last 24 hours.
Quick reminder:Open interest is the total value of open futures contracts.
The total number of active bets is dropping alongside the price, hints that traders are actively stepping away and don’t rush in to place new bets. They are closing out their trades, taking their chips off the table, and waiting on the sidelines until the market picks a clear direction.
2026 & 2027: The average Chainlink price prediction is $14.94, within a range of $7.29 to $41. Standard Chartered targets $13 for 2026 and $41 for 2027.
2028 to 2030: The average is $20.23, within a range of $6.72 to $200. The $200 maximum is Standard Chartered’s 2030 target.
2030-2032: The average is $23.68. CoinCodex, the only model we reviewed that covers 2031 and 2032, stays below $29.19.
Forecasts for Chainlink split into two camps. Algorithmic platforms such as CoinCodex and DappRadar read the charts. They expect LINK to climb slowly and average about $19 by 2030.
Standard Chartered reads the market for tokenized assets. Its analyst Geoff Kendrick set a target of $200 for 2030, about ten times higher.
They all start from the same chart: LINK at about $10 - 80% below its 2021 peak. The difference between the forecasts shows how little anyone knows about the next six years.
Chainlink Price Forecast at a Glance
Minimum and average come from two algorithmic models, CoinCodex and DappRadar. We take the lowest of their yearly lows and the mean of their yearly averages.
Maximum is the highest forecast from any source we reviewed. That includes Standard Chartered, which publishes one target per year instead of a range. A single target cannot give a minimum or an average, so it only sets the maximum.
For 2031 and 2032, only CoinCodex publishes figures right now.
With seven weeks left in 2026, models are watching the $10.10 mark as the baseline. The next upward hurdle is $12.50.
2027 is where experts’ vision on LINK’s future diverge. DappRadar currently lists a "Strong Sell" rating at $10.35, while CoinCodex projects a jump past $25 for December 2027.
In the end, LINK's 2027 price comes down to whether those test runs by Swift and DTCC actually turn into everyday use. But as we saw with Cardano, Polygon, and even Solana, a working product doesn’t guarantee a rising price. Those projects keep rolling out a useful upgrade after upgrade plus growing their daily activity, yet their tokens often sit flat. LINK could easily face that same disconnect.
Factoring in the 2028 Bitcoin halving, CoinCodex projects LINK will peak above $29 in April 2029 before dropping near $17 by September. DappRadar expects a steadier trend, forecasting annual averages between $17 and $19.
Standard Chartered has more aggressive targets on tokenization, projecting the sector will reach $4 trillion by 2028 and multiply Chainlink’s fee revenue by 25.
A $200 LINK by 2030 would nearly quadruple its 2021 high of $52.88.
The bank warns this could all fall apart if banks drag their feet on adopting it, governments step in with strict rules, or the tech breaks, or a rival project simply beats them.
Chainlink long-term price prediction published by CoinCodex sees LINK ending 2030 near $22, then flattening. The average is $25.22 in 2031 and $26.46 in 2032, and the maximum stays below $29.19 in both years. That is about 45% under the 2021 peak.
A forecast this far out is a trend line built on price history. It cannot see the next regulation or exchange hack, so it’s very approximate.
ChangeNOW Internal Stats on Chainlink
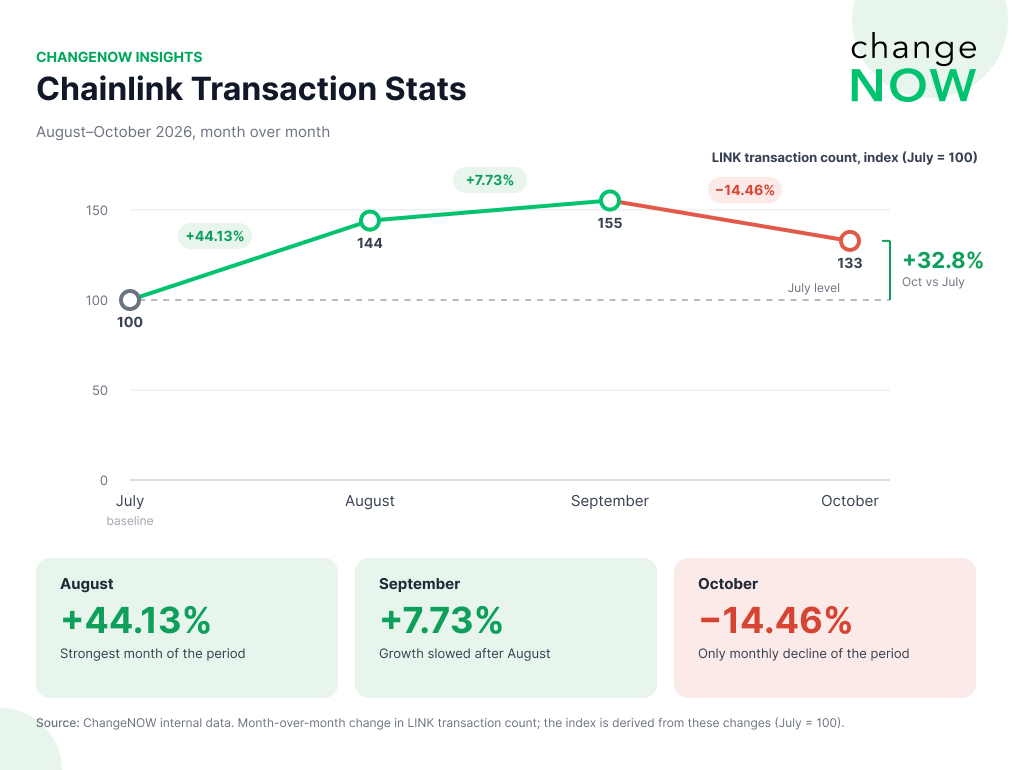
When we look at user activity for LINK on ChangeNOW, the data reflects a sharp cooldown following a late-summer rally. While August and September saw solid growth, that momentum broke heading into the fourth quarter.
Overall Swap Trends
Transaction counts for LINK changed drastically over the last few months.
In August 2026, transactions jumped by 44.1%. Growth continued into September with another 7.7%. But then October reversed that trend with a 14.4% drop in transaction count.
Top Trading Pairs
The specific pairs users choose show a clear preference for stablecoins when entering the asset, and Bitcoin when exiting.
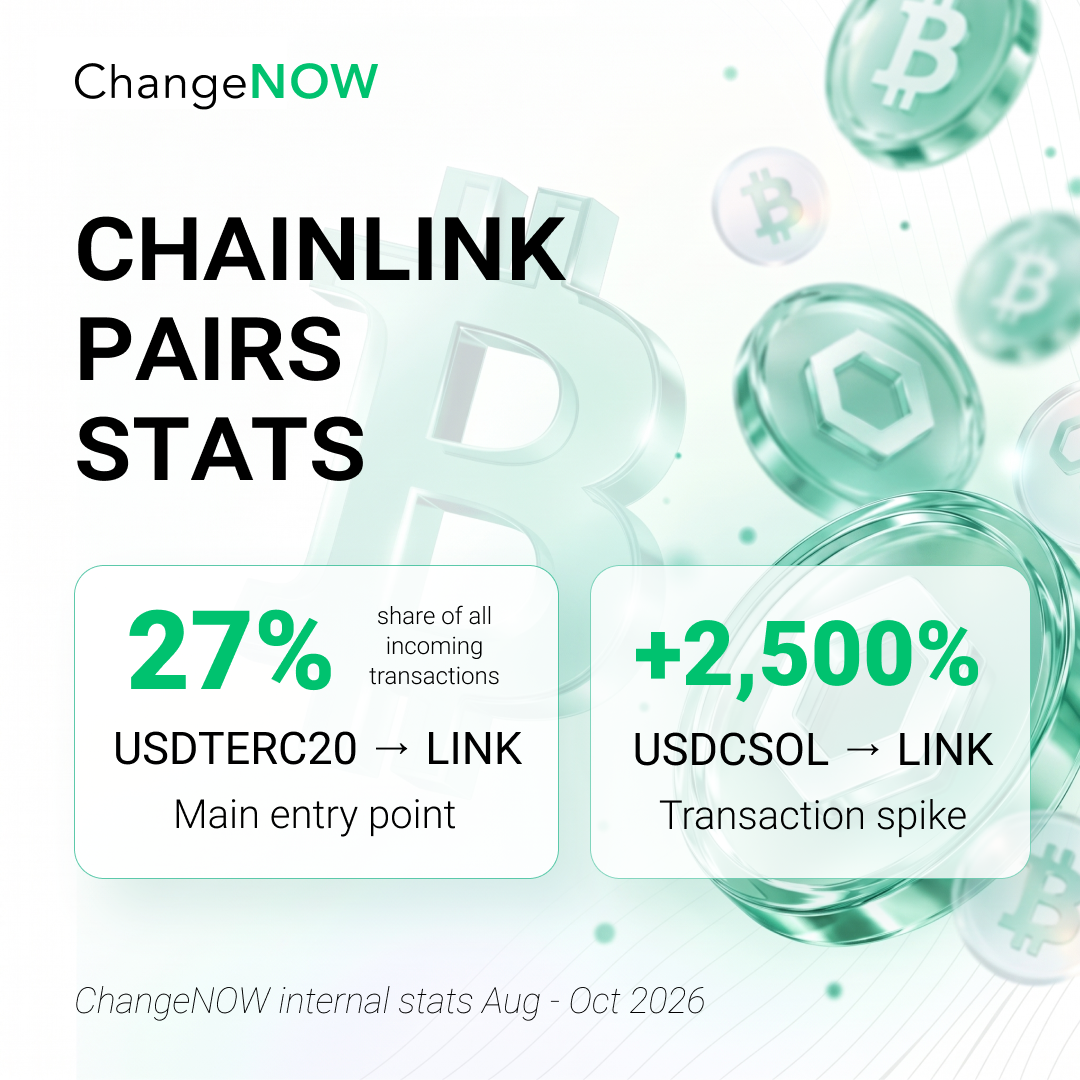
Users buying LINK: USDT on Ethereum network remains the primary entry point, making up 27.48% of all incoming transactions. The most aggressive new growth is coming from the Solana ecosystem. Users swapping from Solana-based USDC into LINK saw a sudden 2500% spike in transaction activity during the 3 months period. When combined with a 275% jump in direct SOL-to-LINK swaps, it highlights a very targeted move by Solana-based traders turning to Chainlink.
Users selling LINK: The LINK-to-BTC pair leads all outgoing trades, capturing 16.96% of the outgoing transaction share. The transaction count for this specific pair also grew by 45%, showing a steady, ongoing rotation by users moving their LINK holdings directly back into Bitcoin.
Network Activity
Ethereum completely dominates LINK's network activity on the platform. The Ethereum network currently handles 79.7% of LINK-related transaction shares on ChangeNOW. The BNB Smart Chain is a distant runner-up, accounting for just 9.3% of the share.
Quick reminder:On ChangeNOW LINK coin is available on 4 networks: Ethereum, BNB Smart Chain, Polygon and Arbitrum One.
For LINK to reach higher targets, the network's high-profile partnerships must translate directly into token demand.
From pilots to daily volume: The current test runs by Swift and DTCC must transition into actual everyday use.
Direct token utility: Institutions using the CCIP need to drive the transaction volume that specifically requires the LINK token to operate.
The $4 trillion tokenization market: Standard Chartered’s projection for the tokenized asset market by 2028 has to become reality.
Consistent fee revenue: If TradFi adopts Chainlink as its standard infrastructure and generates steady fees, the rift between project development and token price will finally close.
What Needs to Happen for LINK Price to Fall
The primary risk to LINK is the ongoing disconnect between project utility and token value.
Bypassing the token: If banks adopt the underlying technology but find ways to execute transactions without using the LINK token itself, the price will remain flat regardless of bullish headlines.
Holder fatigue: The token could drop heavily if long-term holders finally lose patience with the promised adoption narrative and exit their positions.
Macro and structural threats: The price faces severe headwinds if the broader tokenization trend stalls, governments introduce strict regulations, or rival oracle providers beat Chainlink to the institutional market.
Chainlink Price Prediction: Final Verdict
Chainlink is caught in a strange limbo. The project itself is a massive success. It's the uncontested plumbing of crypto, and with Swift and DTCC on board, it's making serious moves into the TradFi territory. But as the charts show, building great infrastructure doesn't automatically make a token’s price go up. Sadly.
True success depends on global banks not just adopting the software, but actually using the LINK token to pay for transactions.
If that value capture happens, the conservative $20 estimates for 2030 will look foolishly low.
If it doesn't, LINK’s price could simply continue to lag behind the project’s real-world achievements, keeping the chart disconnected from the network's actual growth.
They are not reliable guarantees. Algorithmic models project past trends into the future, and analysts make educated guesses based on adoption rates. Neither can predict exchange hacks, sudden regulations, or macroeconomic shifts. Always treat them as abstract scenarios.