Remember when crypto felt like its own little universe? Bitcoin halving happens, price goes up. BTC breaks its old ATH, altcoins follow a few months later.
You could almost set your watch on it.
That version of crypto is gone. In 2026, Bitcoin doesn't move solely because of on-chain narratives or miner economics. It moves because Trump spoke about tariffs, or institutional desks are rotating out of risk at year-end, or the dollar strengthened for three weeks straight. The halving still plays its role, but so does a Fed meeting, and now the Fed meeting matters more.
This article is about the market that got deeper, more liquid, more connected to everything else. And in doing so it became both harder to blow up and harder to get rich in.
When Crypto Lived in Its Own Bubble
To appreciate how much has changed, it's worth speaking first about how the old cycles actually worked.
The 2017 Retail Mania
2017 was a carnival. Retail money poured in from everywhere. The market was thin, information was all over the place, and you could 50x a mid-cap altcoin just by getting in before the crowd noticed it existed.
ICOs raised millions on PDFs. Projects with zero code and anonymous teams hit hundred-million-dollar valuations because their Telegram had 80k members.
2020-2021: Stimulus, DeFi, and Meme Mania
2020-2021 was more grown-up, but the internal logic was the same.
Bitcoin's third halving in May 2020 cut miner rewards in half, the supply-scarcity narrative caught fire, and then a trillion dollars of pandemic stimulus decided crypto looked like a fun place to be. A Coinbase listing could add 40% to a token in a day. Elon tweeted about Dogecoin and it was a genuine market event.
DeFi summer happened in weeks. Highly recommend watching this report after you finish reading the article to better understand the scale and long-term impact of what happened.
NFTs minted millionaires from JPEGs in months. The meme coin machine ran on reflexivity: social media hype drove price, price drove even more hype, repeat until the music stopped. None of this had anything to do with interest rates or dollar strength.
Crypto was its own thing, running on its own fuel. The rest of the financial world was background noise.
Crypto Leaves the Sandbox
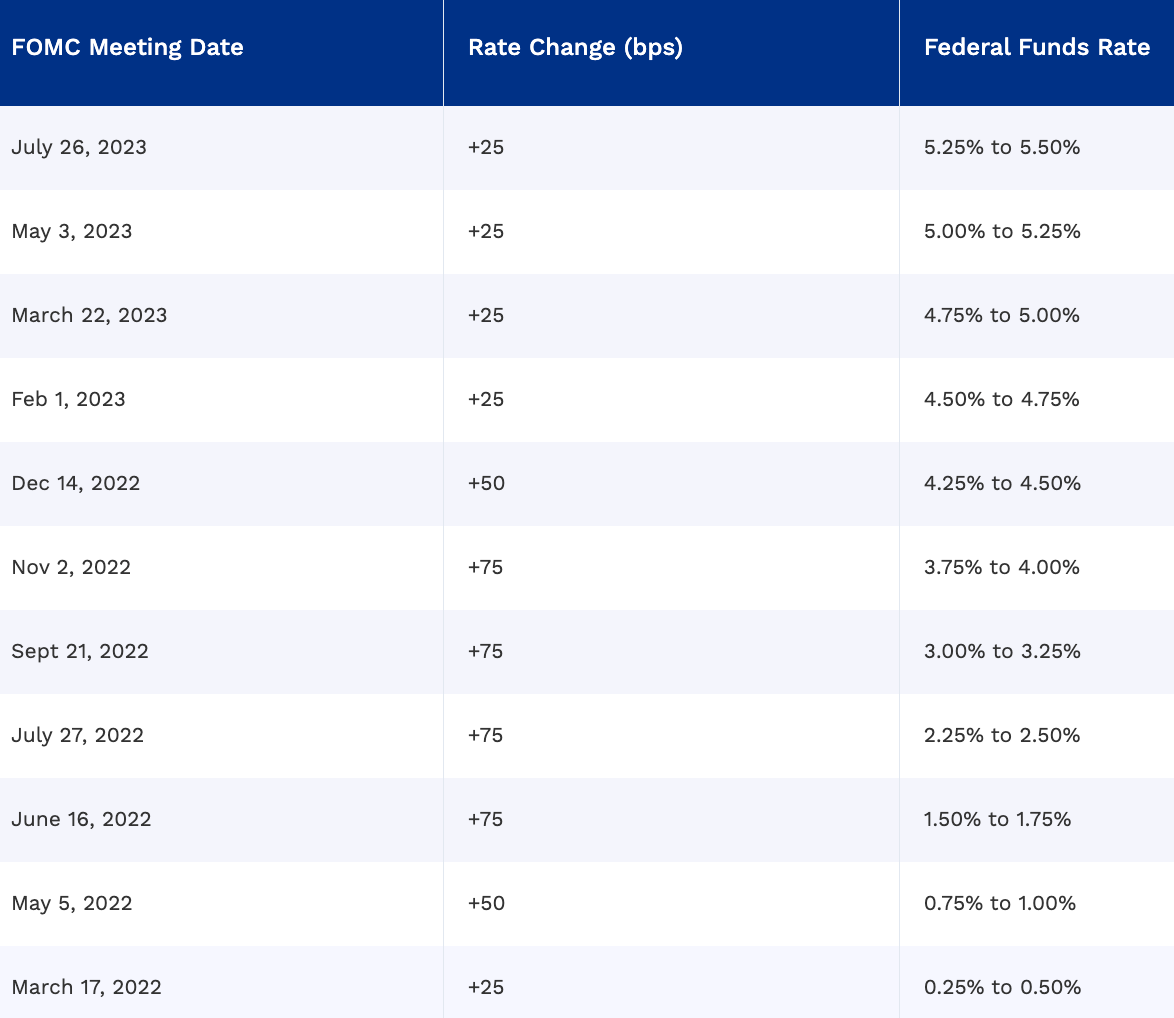
The break happened in 2022.
The Fed started hiking rates at the fastest pace in forty years.
Risk assets sold off globally. Tech stocks dropped 40-70%. And Bitcoin, which was sitting near $69K in November 2021, fell to under $16K by December 2022. Picture source: CoinMarketCap Bitcoin page
That's a 77% drawdown. But here's the thing: It was a risk-asset repricing, and crypto happened to be the most risk-on thing in anyone's portfolio.
Terra/Luna collapsed, FTX imploded. Those were internal disasters and they made the headlines.
When conditions eventually improved (rate cut signals, liquidity loosening) crypto came back. But the timing was determined by macroeconomics, not by events happening on-chain.
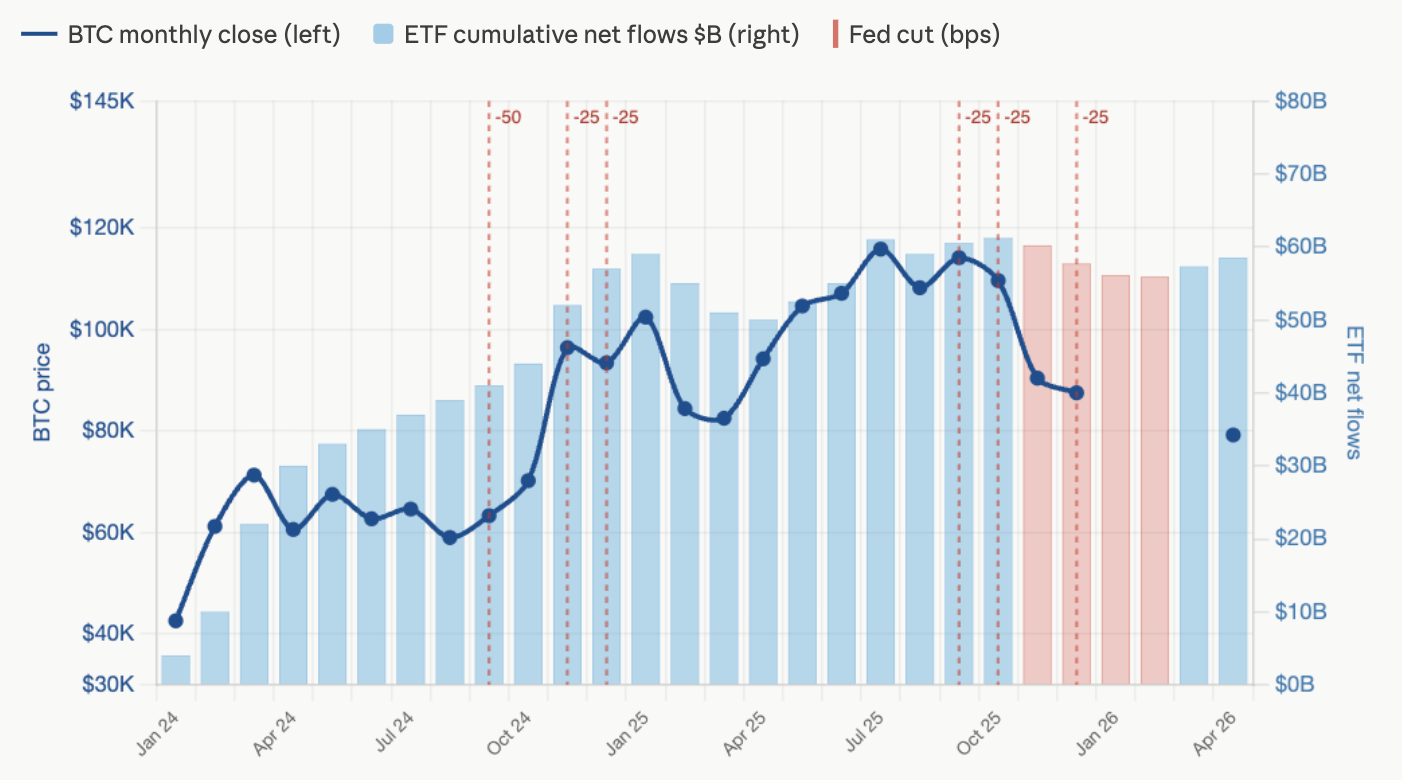
Bitcoin's fourth halving in April 2024 came and went without the usual fireworks. The analysts who positioned for a 2020-style halving pump were left waiting. The actual move came later, when the Fed cut rates and ETF inflows accelerated.
Why Macro Dominates Crypto Now
Let's look at the actual numbers.
Bitcoin-Nasdaq-100 Correlation
Metric
Value
BTC/NDX correlation — 2021
0.35
BTC/NDX correlation — 2022
0.55
BTC/NDX correlation — 2023
0.38
BTC/NDX correlation — 2024
0.53
BTC/NDX correlation — 2025 average
0.54
Peak correlation post-ETF approval (2024)
0.71
BTC daily volatility vs S&P 500
3-5x higher
S&P 500 drawdown in 2022
-19%
Bitcoin drawdown in 2022
-65%
S&P 500 gain in 2024
+24%
Bitcoin gain in 2024
+130%
Correlation was calculated using monthly data for Bitcoin and the Nasdaq-100 over the same time period.
What it means in simple terms: correlation measures how often two assets move in the same direction:
+1.0 means they move almost perfectly together
0 means there is no meaningful relationship
-1.0 means they usually move in opposite directions
A BTC/Nasdaq correlation around 0.7 suggests that Bitcoin increasingly behaves like a high-risk macro asset influenced by the same factors driving tech stocks: interest rates, liquidity conditions, and overall investor appetite for risk.
In post-ETF approval time, when the stock market goes up 24%, crypto goes up 135%. When the stock market drops, crypto drops harder and faster. The direction is the same; the amplitude is just bigger.
Redditors noticed this correlation four years ago. Some argue that it goes against crypto’s core idea, while others claim it was predictable.
To me, it doesn't mean that Bitcoin directly tracks the Nasdaq or has become “just another tech stock.”
But after:
massive post-COVID liquidity injections,
institutional adoption,
spot Bitcoin ETFs,
and growing corporate exposure,
Bitcoin started behaving much more like a macro risk asset.
Interest rates vs BTC
When rates are near zero, money goes looking for yield. Crypto is high-risk/high-potential-return, zero cash flow – perfect for a zero-rate world. When rates hit 5%, a risk-free Treasury suddenly competes with your speculative portfolio. Institutional managers with fiduciary duties don't pick crypto over 5% guaranteed.
year
Fed rate
Rate direction
BTC return
Era
Key driver
2017
1.25%-1.50%
↑ Hiking
+1,369%
Retail mania
ICO boom, retail euphoria, Japan legalizes BTC, South Korea enters the market, CME Bitcoin Futures announcement, BTC hardfork. BTC is still decoupled from macro, rates irrelevant.
2018
1.50-2.50%
↑ Hiking
−73.6%
Bubble burst
ICO bubble collapsed. Regulatory pressure, Crash was internally driven, not macro. Rates are a secondary factor.
2019
1.50-2.25%
↓ Cutting
+92.2%
Easing begins
Fed pivoted to cuts mid-year. BTC recovered on liquidity optimism, Libra announcement.
Rates still near zero, unlimited liquidity. NFT mania, DeFi summer, El Salvador legal tender, China banning mining. BTC ATH $69K, Institutional FOMO phase & Retail mania
2022
0.25-4.50%
↑↑↑ Aggressive hike
−64.3%
Rate shock
Fastest hiking cycle in 40 years (0.25% → 4.5%). Risk-off across all assets. Terra/Luna collapse, FTX fraud amplified macro selloff.
2023
4.50-5.50%
↑ Peak & hold
+155%
Paradox year ★
Rate at 5.5%, highest since 2001, yet BTC surged on ETF approval expectations and end-of-hiking narrative. AI-driven Nasdaq rally. Banking crisis. Forward guidance beat current rate.
2024
4.25-4.75%
↓ Cutting
+121%
Institutional era
Spot ETF approved, massive nflows. BTC Halving. First rate cut Sep 2024 (−50bps). Trump election. BTC broke $100K for the first time.
2025
3.50-4.0%
↓ Cutting
−6.3%
Institutional era
First post-halving year with negative return in BTC history. Post-ETF maturation phase. Institutional dominance increases. ATH $126,198, then institutional de-risking drove −27% drawdown into year-end.
When rates are low or being cut, there is more cheap liquidity in the system, and risk assets like BTC tend to perform well. When rates rise quickly, liquidity tightens, and Bitcoin usually drops along with other risk assets, as we saw in 2022.
But it’s not a direct “rates up = BTC down” rule. In 2023, for example, rates were at their highest levels in decades, yet Bitcoin still rallied. That happened because markets started pricing at the end of the tightening cycle, and new drivers like ETF expectations and institutional demand began to dominate.
The key idea is simple: interest rates matter, but they affect Bitcoin mainly through liquidity and market expectations, not as a direct price mechanism.
A trader's perspective adds another layer to this. Hyperliquid whale & Swing trader @kunoo shared:
Honestly I think crypto in 2026 moves mostly off liquidity and positioning now, not tech. The market reacts hardest to rate cuts, money supply expansion, ETF flows, and how aggressive institutions are willing to get with risk exposure.
A lot of people still underestimate how much derivatives control price action too. Open interest, leverage stacking, liquidation cascades, perp funding, etc. All of that moves the market faster than fundamentals most of the time.
Narratives still matter though. AI, RWAs, memecoins, Bitcoin treasury companies, whatever gets attention first usually gets capital first. Crypto’s basically a mix of macro economics, crowd, psychology and liquidity hunting at this point.
That last point is worth sitting with. Crypto didn't lose its narrative-driven nature, it just added a macro layer on top. The narratives still determine where capital goes within the ecosystem. Macro and liquidity determine whether it comes in at all.
Geopolitical Volatility – What It Actually Does to Crypto Markets
The relationship between Bitcoin and geopolitical shocks is one of the most misread dynamics in crypto markets. The popular narrative runs in two contradictory directions simultaneously: Bitcoin is "digital gold" and therefore a safe haven during crises. But also a risk asset that crashes whenever anything happens. Both are partially true, which is part of why the picture is messy. Here's what the data actually shows.
BTC sells off on the shock, recovers within days. Russia-Ukraine (Feb 2022): −8% to $34,413 in 24 hours, recovered to $48K within weeks. Iran-Israel missile exchange (Apr 2024): ±3% on the day of the strike. US-Israel direct strikes on Iran (Feb 2026): −3–4.5% to the $63K range, stabilized within days. The pattern is mechanical and consistent, and the magnitude is shrinking with each event as institutional depth increases.
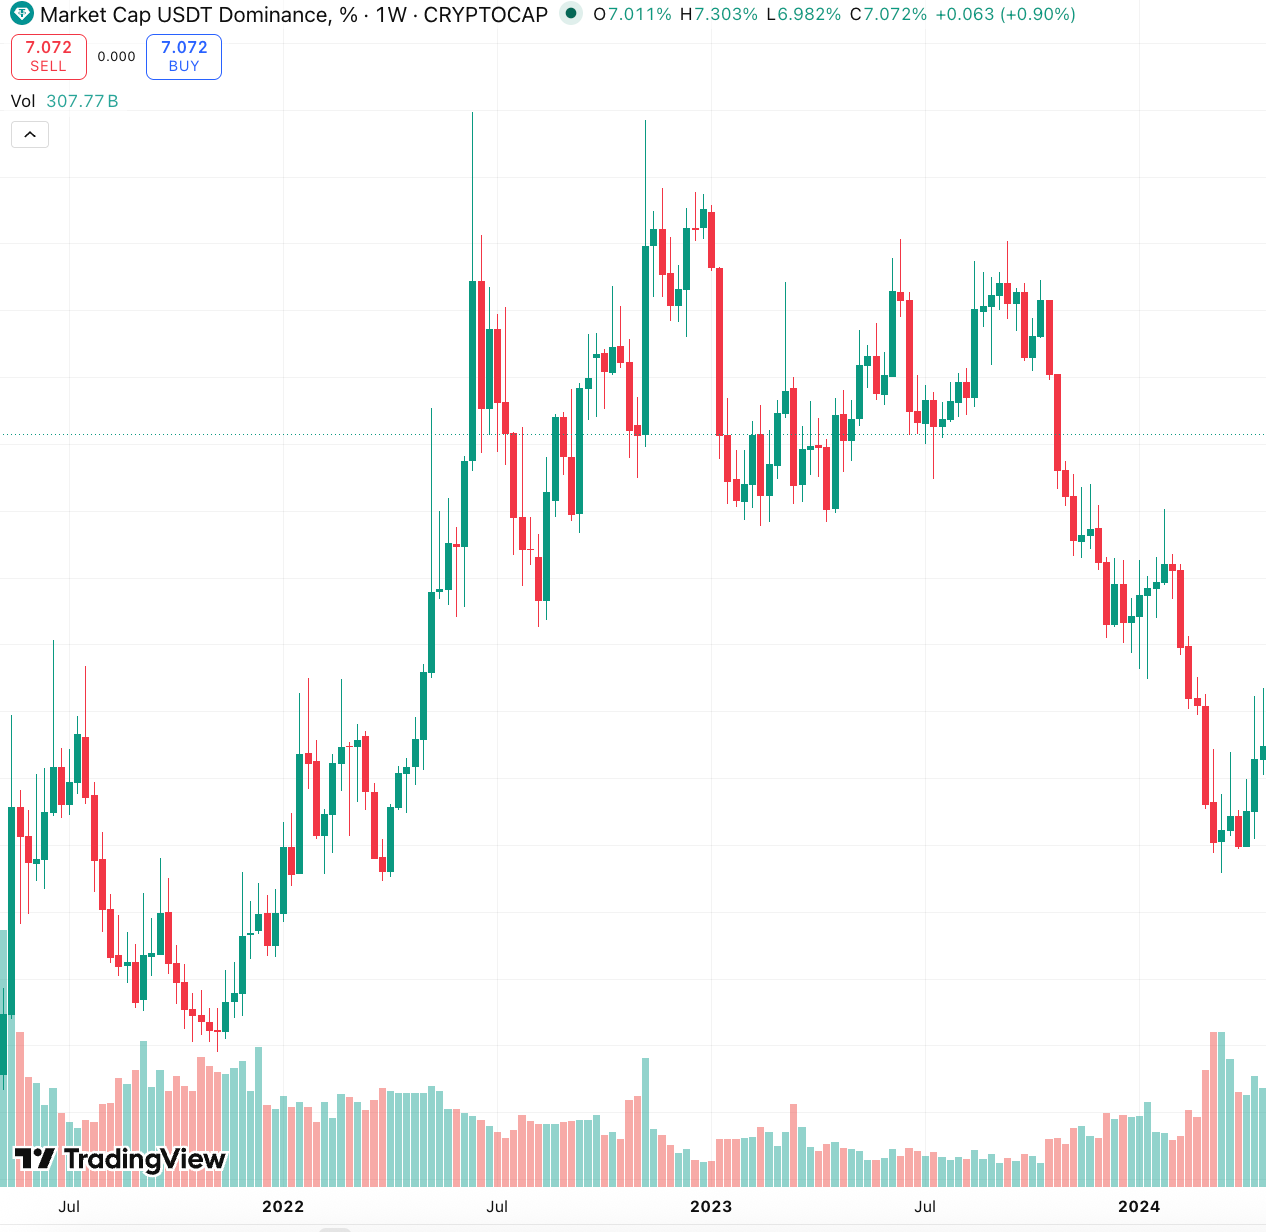
Stablecoin dominance spikes. The cleaner signal is not BTC price but stablecoin flows.
During periods of geopolitical or macro stress, Bitcoin typically sells off alongside other risk assets. And stablecoin usage increases sharply. Capital rotates within the crypto ecosystem, moving from volatile assets into dollar-denominated ones. Stablecoins effectively function as a digital USD liquidity layer: holders preserve value and maintain optionality without exiting crypto entirely.
This pattern showed up consistently across the major conflict events between 2022 and 2026.
In short: geopolitics usually hits Bitcoin like a risk asset, it drops when fear spikes, then often recovers quickly once things calm down. The clearer signal is inside crypto itself: in stressful moments people don’t leave the system, they move money from Bitcoin into stablecoins to sit in “digital dollars”.
ETF Flows vs. Halving Narratives
The approval of spot Bitcoin ETFs in January 2024 was, probably, the most structurally important event in recent crypto history.
It changed how Bitcoin actually moves. Instead of reacting mainly to narratives like halvings, the market is now heavily driven by ETF inflows and outflows. Basically real money coming in and out through institutional channels. That’s what sets the direction more than anything day to day.
The halving still exists and still matters in the background because it reduces new supply. but its impact on price in the short term is much weaker than in earlier cycles.
More details on how halving dynamics and ETF flows work together in the current cycle are in the previous article.
Crypto Community Got Smarter
Retail crypto investors in 2026 have been through things. And it shows.
Rug pulls & exit scams
In 2021, rug pulls alone accounted for roughly 37% of all cryptocurrency scam revenue. Thin projects with no real product, anonymous teams, liquidity pulled overnight. By 2025, coordinated exit scams had evolved: fewer in number but far more elaborate, often dressed up as legitimate DeFi protocols with audits, DAOs, and working front-ends. The $290M MetaYield collapse is the clearest example. It looked credible right up until it didn't.
Straightforward scams
The broader fraud landscape peaked around 2022, the year Terra/Luna and FTX collapsed within months of each other. Total losses that year ran to roughly $6B.
By 2023 the number had fallen to around $2B as the easy retail money dried up and the lessons started landing.
2024 saw a brief spike back to ~$4.1B, driven largely by celebrity token launches and coordinated pump-and-dumps. But the incident count was already declining. In 2025, incidents dropped 66% year-over-year, even as individual scam sizes grew larger.
That kind of education is expensive and permanent. The result is a retail base that now reads unlock schedules, checks whether liquidity is locked, Googles the team. Now we treat a celebrity endorsement as a red flag rather than a signal (or at least more cautious).
Now “100x pump” is a signal that something may be wrong, not a signal to buy ASAP:
On-chain data tools developed too. In 2017, tracking a whale wallet required technical skills most people didn't have. In 2026, you get Telegram alerts when a specific address starts moving funds.
The information edge that sophisticated players had, knowing what insiders were doing before everyone else, has massively compressed.
The Death of Easy Multipliers?
The question everyone actually cares about: are the 100x days over?
Let’s look at figures.
Post-Halving Bitcoin Gains by Cycle
Halving Cycle
Date
Max Post-Halving Gain
1st halving
November 2013
+8,500%
2nd halving
July 2016
+2,800%
3rd halving
May 2020
+650%
4th halving
April 2024
+100%
Each cycle, the percentage gains compress. That's just math, it takes more capital to move a larger market. Bitcoin hitting $126K in October 2025 was a 100% gain from the halving. That's still a great trade. But it's not the 600% you got in 2020.
For altcoins it's more complicated. The market now has tens of thousands of tokens competing for the same pool of speculative capital. Liquidity is fragmented across dozens of chains, hundreds of DEXs, and multiple institutional venues. There's no longer one place where the whole market's attention concentrates, it's split everywhere.
In 2020, if you identified a promising DeFi protocol early, you had weeks before the broader market caught on. In 2026, that window is hours. On-chain bots and copy-trade tools have industrialized opportunity identification. By the time something looks like an obvious trade, the easy money is already gone.
None of this means big returns are impossible. It means they require more specific insight than "buy the narrative and wait." Structural shifts still create opportunities. They're just harder to find and faster to close.
People See the Market Now, Not Just the 100x
The shift shows up in how people talk about the market now. The vocabulary has changed:
I think crypto prices in 2026 will mostly be driven by institutional adoption, regulations, and overall market liquidity. Bitcoin will still lead market sentiment, but projects with real utility and strong communities will probably perform the best long term." – Tyler Hill, @tylerhillcryptoyt on YouTube, in a comment exclusively shared with ChangeNOW.
A few years ago that read would have seemed boring. In 2026 it's just the baseline.
Are 4-Year Cycles Still Real?
Depends who you ask. And in 2025, a lot of serious people gave very different answers.
Industry Verdict on the 4-Year Cycle
Voice
Call
Their Reasoning
Cathie Wood, ARK Invest
Disrupted
Macro and institutional flows dominate halving mechanics
Arthur Hayes, BitMEX co-founder
Dead
Market structure has fundamentally changed
Matt Hougan, Bitwise CIO
Dead
Three drivers now: ETF flows, Wall St adoption, regulatory regime
Markus Thielen, 10x Research
Evolving
Continues but no longer dictated purely by supply cuts
Some analysts take a longer view entirely. Rather than debating whether the four-year cycle is dead or intact, they argue the frame itself is too narrow. We got interesting take from Paul Sampson (DataDash):
What we're witnessing in 2026 is a maturing asset class finding its footing in a complex macro environment. The Federal Reserve's rate path, institutional adoption through spot ETFs, and Bitcoin's increasing correlation with traditional risk assets are all reshaping how crypto trades cycle to cycle.
The factors that will drive price in 2026 are less about hype and more about real capital flows, regulatory clarity, and where global liquidity is heading. When you see corporate profits up 28% year over year alongside markets at all time highs, that's the macro backdrop crypto is operating in. Risk assets move with liquidity, and liquidity is still expanding.
What's interesting is the longer arc of this. We may be watching crypto's first true 20 year market cycle play out in real time. Each cycle brings new participants, new infrastructure, and new price discovery.
If that's right, then the four-year debate might be a bit like arguing about a single chapter while the book is still being written. Crypto may simply be too young for anyone to know what its natural rhythm actually looks like.
The community remains divided. Some believe the cycle has changed, but not disappeared entirely. Bitcoin peaked at $126K, which some see as proof that the cycle still works.
The honest answer is probably both: the rhythm exists, but it no longer does the heavy lifting it once did.
So, does halving narrative still work?
Bitcoin closed 2025 lower than it started. First time that's happened in a post-halving year. Prior cycles all delivered massive gains in the year after a halving. 2025 didn't.
The structural reason is straightforward: the halving narrative worked when retail sentiment was the dominant price driver. Halvings gave retail a story to coordinate around. "Supply gets cut, price goes up" is simple enough that millions of people can act on it simultaneously, which becomes a self-fulfilling prophecy.
But a halving doesn't change the interest rate environment.
The counterargument is that the 1,064-day timing of the October 2025 peak matches prior cycles almost perfectly, suggesting some underlying rhythm persists even if the returns have compressed. Maybe the cycle is real but just quieter now. Maybe it takes longer to play out in a larger market.
In short: the four-year cycle is a useful historical reference, not a reliable trading signal. If you're timing entries purely based on halving schedules in 2026, you're using a model that hasn't been current for at least one full cycle.
Conclusion: Mature Markets Are Harder Markets
Crypto didn't get simpler when it grew up. It got harder, just in different ways than before.
The integration into global finance is probably net positive for the ecosystem's long-term stability. More institutional capital means more liquidity, less susceptibility to manipulation at scale, and fewer situations where a single bad actor takes down an entire chain's economy. Harvard's endowment doesn't panic-sell on a bad tweet. The infrastructure is more solid than it was.
But the cost is real. The inefficiencies that made crypto so profitable for early participants are shrinking. The narrative-driven pumps that once didn't need any external justification now have to compete with a global macro environment that couldn't care less about tokenomics.
Speculative opportunities still exist. Meme coin cycles on Solana, early positions in genuinely new infrastructure, macro-timed rotation plays. But the era where you could do well just by showing up, buying something with a good narrative, and waiting for the wave, is largely over.
Whether that's a loss depends on what you wanted from it. The market left the sandbox. It's not going back.
Data sources & Methodology
This article is based on a combination of quantitative data analysis, chart research, and expert commentary. Price and return data was sourced and analyzed across multiple market cycles to identify patterns in Bitcoin's behavior relative to macro conditions. Correlation figures were calculated using monthly BTC and Nasdaq-100 data over comparable time periods.
To supplement the data, we reached out to our partners and industry voices for their perspective on the current market structure. Exclusive comments were provided by
Paul Sampson of DataDash,
trader @kunoo,
and Tyler Hill. We're grateful to each of them for sharing their insights!
When AI Pays AI: Building the Infrastructure for M2M Payments
Autonomous AI agents need a fast, reliable way to transact. We explore how L2 networks and smart contracts are solving the payment bottleneck for the machine-to-machine economy.
When Bitcoin dips, social media starts to panic, and somewhere a fund is just quietly rebalancing a position. Here's how whales financial reality look, and why their bad day never feels like yours.
What Are Crypto APIs, And How To Profit From Them?
Whenever you want to implement a new crypto feature on your platform but don’t want to spend great money and time on development, crypto APIs are the solution.

 Picture source:
 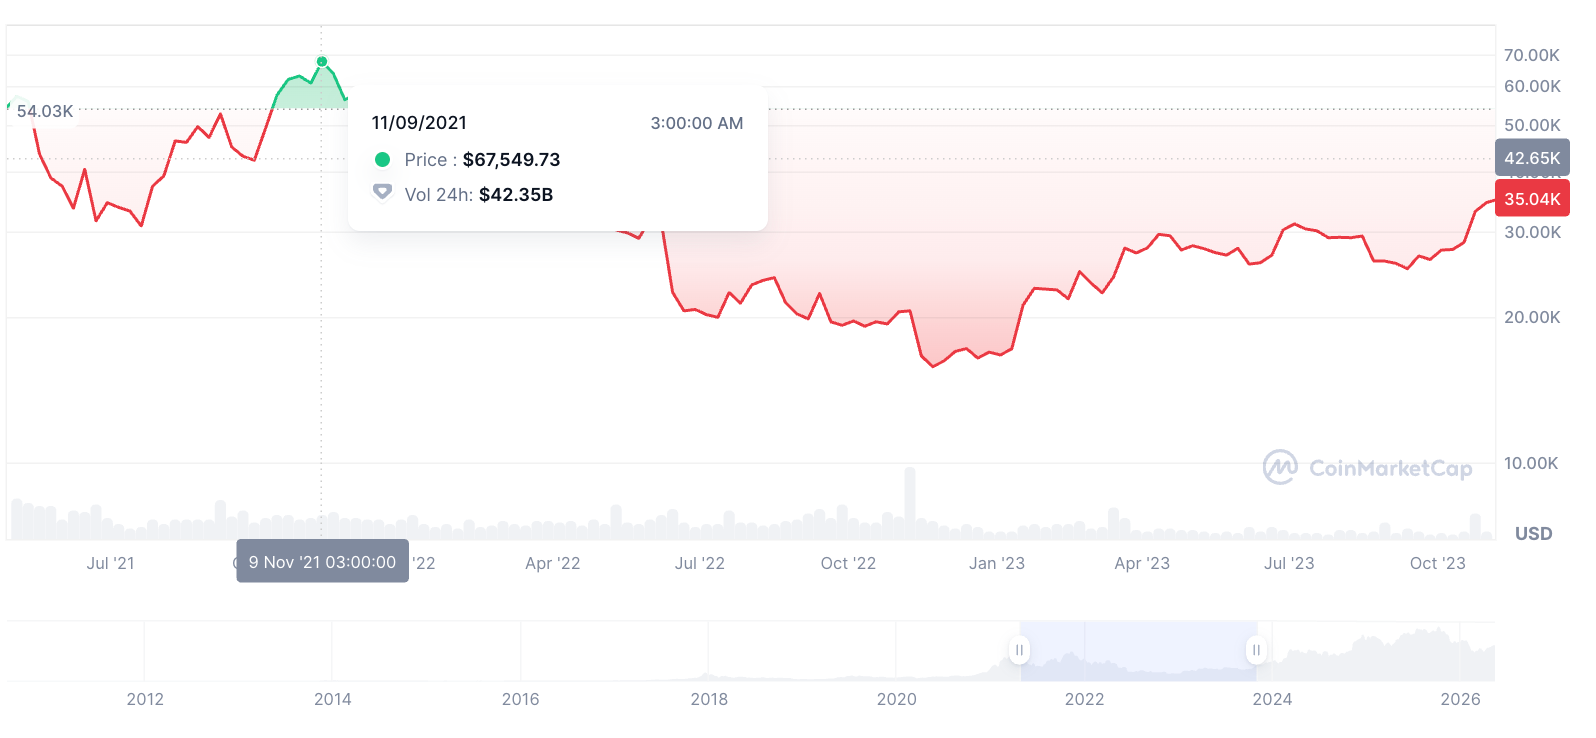 Picture source: